insight
AAM Corporate Credit View: Fall 2014
October 15, 2014
Investment Grade Corporate Credit Remains Resilient Despite Heightened Volatility
By Elizabeth Henderson, CFA
Director of Corporate Credit

[toc]
Market volatility has increased, and although investment grade corporate bonds outperformed riskier asset classes such as high yield (-1.9%) during the third quarter, spread volatility increased modestly.
In this newsletter, we support our near term outlook for corporate credit by focusing on two important drivers of expected performance for the fourth quarter 2014: energy prices and consumer spending. We expect spreads to tighten over the near term, as U.S. GDP growth meets or exceeds expectations and as oil prices stabilize. We also expect the negative market technicals we experienced in September to reverse. Lastly, we close the newsletter with a brief discussion of the private placement market. The biggest near term risk to our forecast is a retrenchment by the consumer due to Ebola concerns.
Corporate credit spreads widened due to falling commodity prices and technical pressure
Corporate credit spreads widened 13 basis points (bps) (Exhibit 1) in the third quarter with the majority of the widening taking place in September. Market volatility increased due to the uncertainties regarding the timing of Federal Reserve interest rate increases, geopolitical issues, the Ebola virus, and the impact slowing European and China growth will have on company fundamentals. Specifically, in regard to the Investment Grade (IG) Corporate bond market, we believe spread widening was driven more by: 1) lower commodity prices, affecting the Energy and Metals and Mining sectors, and 2) weaker market technicals. The expected supply of bonds increased due to a larger than expected amount of new bonds issued by companies in September ($70 billion for the first eight days in September versus a monthly estimate of $100 billion) as well as the threat of selling as a result of the changes at PIMCO. In early October, spreads stabilized with demand increasing from mutual funds. However, entering mid-October, Treasury yields are falling and spreads are increasing in reaction to weaker than expected economic data and Ebola concerns.
Exhibit 1
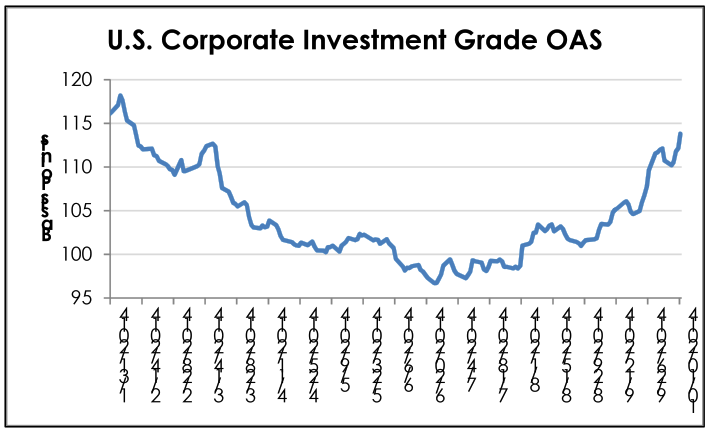
Source: Barclays, AAM
Exhibit 2: Weekly mutual fund net flows in HG credit funds
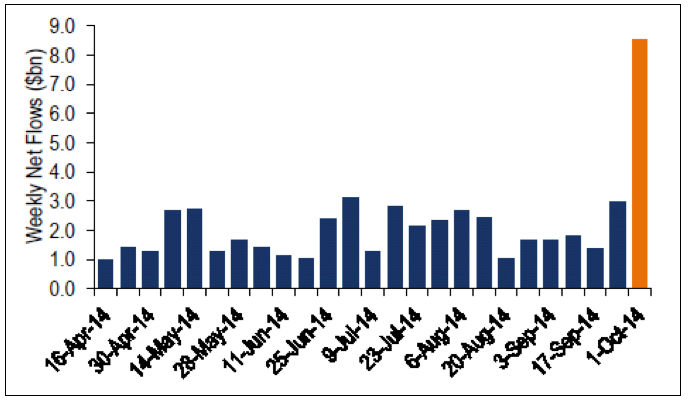
Source: BofA Merrill Lynch Global Research, EPFR
The IG Corporate market generated 0.2% total return (-0.8% excess return) in the third quarter, as represented by the Barclays Corporate Index. As investors fled to higher quality securities, BBB rated securities generally underperformed (Exhibit 3), widening the basis between A and BBB rated Industrial securities from 44 bps at the end of the second quarter to 50 bps. Spread volatility picked up slightly in the third quarter, but still remains very low at 6 bps year-to-date.
Exhibit 3
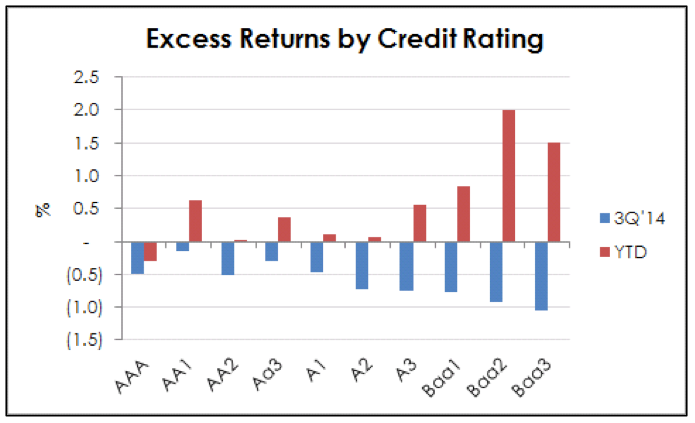
Source: Barclays, AAM (YTD as of 10/9/14)
Last quarter, we wrote that we believed defensive, not bearish, positioning was appropriate given the low spread levels and increasing idiosyncratic risks. One can see the benefits of a more defensive portfolio, as shown by Exhibit 4, detailing the number of tickers that had excess returns greater or less than the mean. It is clear that last month’s performance was driven by a number of mid-to-low BBB credits, mainly in the Energy and Metals and Mining sectors.
Exhibit 4
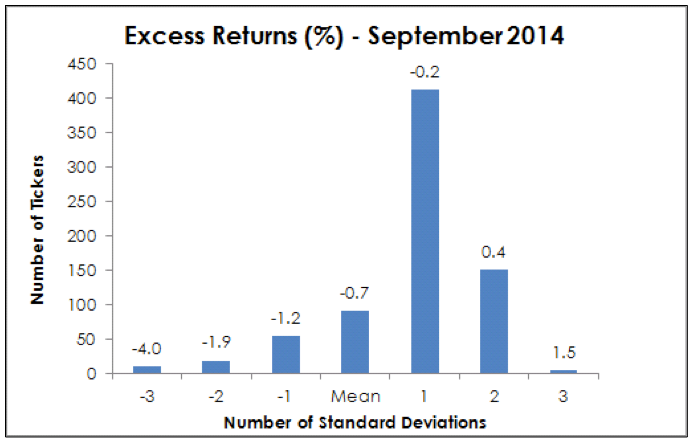
Source: Barclays, AAM
Economic growth is accelerating from a weather driven first half of the year
Third quarter GDP for the U.S. is estimated at 3%, and domestic economic data has surprised to the upside in the third quarter. Importantly, the JOLTS (Job Openings and Labor Turnover) survey continues to report a higher level of job openings, now on par with what we experienced in 2001 (Exhibit 5). The rate at which employees quit their jobs (“quit rate”), a measure analyzed by the Fed, continues to lag. We note that the correlation between job openings and quit rate is quite high (0.8, using data since 2000); therefore, one could expect the quit rate to increase. Based on a regression analysis, about one third of wage growth can be explained by the quit rate with a correlation of 0.6. We continue to watch these measures closely since rising wage growth at a time of weak worldwide economic growth would negatively impact credit quality and result in wider spreads. We would expect rising wage growth to positively impact domestic economic growth, helping offset overseas weakness.
Exhibit 5
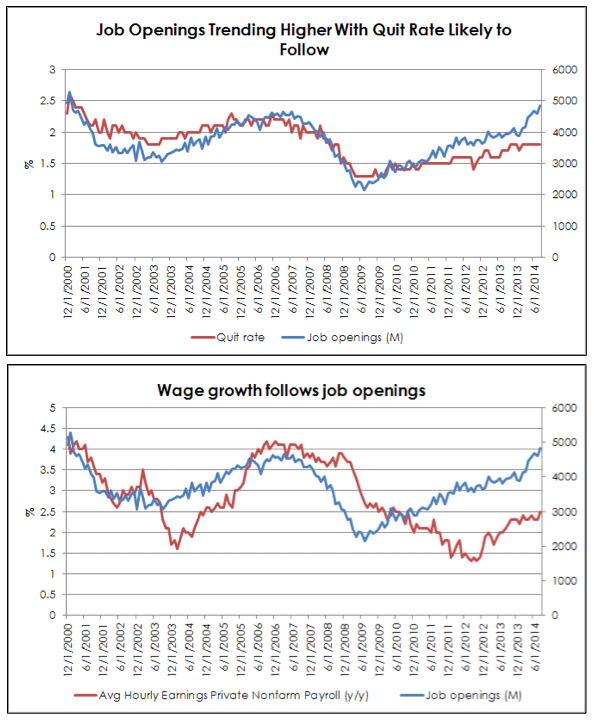
Source: Bureau of Labor Statistics
In terms of economic growth in the fourth quarter of 2014, we expect consumer spending to accelerate, buoyed by higher savings and net worth, available credit, lower gasoline and food prices, rising consumer confidence as well as an improving job market. Risks to this forecast include increased geopolitical risk, unfavorable weather, and/or an increase in Ebola cases in the U.S. or surrounding countries.
In addition to the consumer’s contribution to growth in the fourth quarter, we see positive signs for continued growth in the industrial segment with rail car loadings continuing to climb throughout the year (Exhibit 6).
Exhibit 6
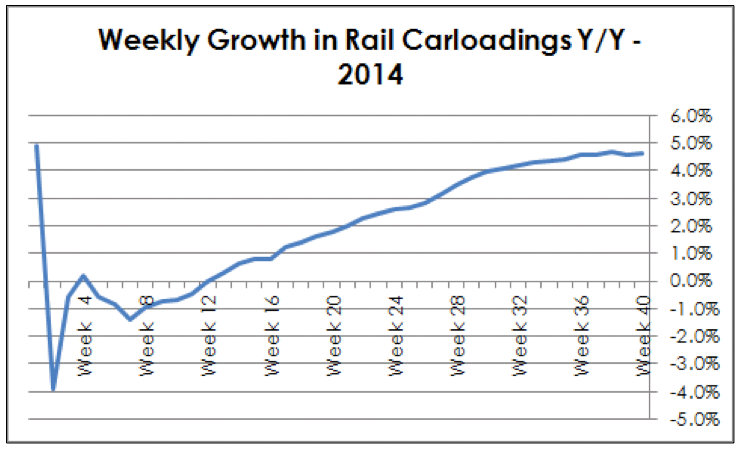
Source: Association of American Railroads, AAM
AAM expects oil prices to stabilize and the price of natural gas to decrease
Our oil forecast of $90 – $95/barrel for WTI over the near term is based on three key items: worldwide consumption, supply and the marginal cost producer (oil sands in Canada and the Bakken Shale). Our forecast of consumption is based on a regression of worldwide oil consumption and GDP since 1970. The International Monetary Fund (IMF)’s worldwide GDP estimate for 2015 is 3.8%, which suggests worldwide oil consumption should increase by about 3% or about 3 million barrels to more than to 95 million barrels per day.
Incremental worldwide supply in 2015 will come from the Bakken Shale in North Dakota, the Permian Basin in west Texas, the Eagle Ford Shale in south Texas (+1.5 million barrels per day) and western Canada (0.4 million barrels per day); potential disruptions in Libya, along with declines in Russia, Mexico and the North Sea should largely offset the production increase in North America.
To meet the 95 million barrels per day of demand in 2015, we believe production from places like the Bakken Shale and the oil sands in Canada will be necessary. We believe that production from those regions require about $90-$95 per barrel to generate a 10% return (Exhibit 7).
Exhibit 7
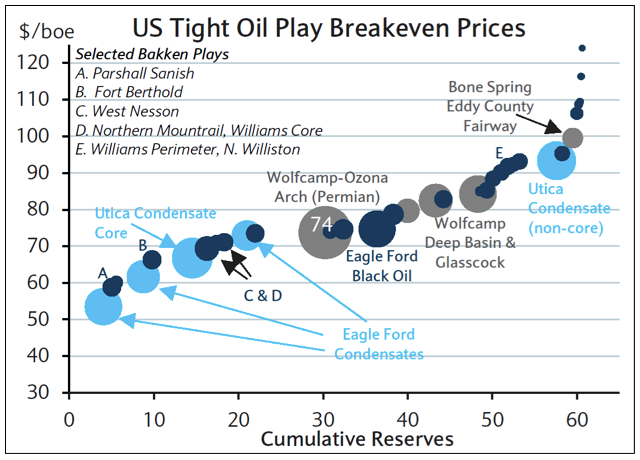
Note: Reserves determine bubble size.
Source: Wood Mackenzie (August 2014), Barclays Research
Our forecast for Henry Hub Natural Gas is $4.00 per MMBtu (million British thermal units). We believe 2015 natural gas demand will be approximately flat with 2014 levels based on a normalized weather pattern (less consumption). Our demand forecast is based on a regression of natural gas consumption and weather degree days (population weighted days above and below 65 degrees Fahrenheit) since 2003. This regression suggests that 83% of the variability in natural gas consumption is determined by weather degree days. Weather degree days (consumption) are 2.5 standard deviations above the long term mean. We believe a reversion to the mean should result in lower demand. Supply remains very abundant. Productivity of 221 million cubic feet per day per rig is 18% greater than 2013 and 52% greater than its three year average.
This forecast results in a bias towards more “oily” Energy credits (vs. natural gas). Recently, we changed our fundamental outlook for the Oil Field Service and Contract Drillers to Negative due to three main reasons. First, the increased supply of rigs concurrent with a decrease in deep water rig demand is causing the daily rental rate for rigs to drop. This is a result of major oil companies focusing more on return on capital employed instead of growth. Secondly, Brazil is unlikely to soak up the excess supply of rigs given the uncertainty in Brazilian economic policy. Lastly, activist shareholders are involved in this sector and will continue to pressure management to generate returns for shareholders at a time when stock prices are at multi-year lows. Spreads widened in this sector, and are currently at levels last seen versus the broad Corporate market in April 2013 when shareholder activists entered the sector, creating uncertainty. We are not ready to buy on this dip since the weakness is fundamentally driven, and we expect it will take time to repair.
Private Placement Market Update
After a slow first half, deal flow has picked up in the private placement market. Generally, we continue to believe we are not getting compensated appropriately for the credit and liquidity risk and/or delayed funding, which is becomingly increasingly common. We recommended one deal that we believe offers at least 100 bps of value versus the comparable public credit, compensating investors for the structural risks and illiquidity.
Outside of private placements, we analyzed less liquid new issues in the public market that were small or had structural nuances. We believed many deals priced with yields too low for the risks assumed, recommending only a few.
Written by:
AAM Corporate Credit Research Team
For more information about AAM or any of the information in the Corporate Credit View, please contact:
Colin Dowdall, CFA, Director of Marketing and Business Development
John Olvany, Vice President of Business Development
Neelm Hameer, Vice President of Business Development
Disclaimer: Asset Allocation & Management Company, LLC (AAM) is an investment adviser registered with the Securities and Exchange Commission, specializing in fixed-income asset management services for insurance companies. This information was developed using publicly available information, internally developed data and outside sources believed to be reliable. While all reasonable care has been taken to ensure that the facts stated and the opinions given are accurate, complete and reasonable, liability is expressly disclaimed by AAM and any affiliates (collectively known as “AAM”), and their representative officers and employees. This report has been prepared for informational purposes only and does not purport to represent a complete analysis of any security, company or industry discussed. Any opinions and/or recommendations expressed are subject to change without notice and should be considered only as part of a diversified portfolio. A complete list of investment recommendations made during the past year is available upon request. Past performance is not an indication of future returns.
This information is distributed to recipients including AAM, any of which may have acted on the basis of the information, or may have an ownership interest in securities to which the information relates. It may also be distributed to clients of AAM, as well as to other recipients with whom no such client relationship exists. Providing this information does not, in and of itself, constitute a recommendation by AAM, nor does it imply that the purchase or sale of any security is suitable for the recipient. Investing in the bond market is subject to certain risks including market, interest-rate, issuer, credit, inflation, liquidity, valuation, volatility, prepayment and extension. No part of this material may be reproduced in any form, or referred to in any other publication, without express written permission.
Disclaimer: Asset Allocation & Management Company, LLC (AAM) is an investment adviser registered with the Securities and Exchange Commission, specializing in fixed-income asset management services for insurance companies. Registration does not imply a certain level of skill or training. This information was developed using publicly available information, internally developed data and outside sources believed to be reliable. While all reasonable care has been taken to ensure that the facts stated and the opinions given are accurate, complete and reasonable, liability is expressly disclaimed by AAM and any affiliates (collectively known as “AAM”), and their representative officers and employees. This report has been prepared for informational purposes only and does not purport to represent a complete analysis of any security, company or industry discussed. Any opinions and/or recommendations expressed are subject to change without notice and should be considered only as part of a diversified portfolio. Any opinions and statements contained herein of financial market trends based on market conditions constitute our judgment. This material may contain projections or other forward-looking statements regarding future events, targets or expectations, and is only current as of the date indicated. There is no assurance that such events or targets will be achieved, and may be significantly different than that discussed here. The information presented, including any statements concerning financial market trends, is based on current market conditions, which will fluctuate and may be superseded by subsequent market events or for other reasons. Although the assumptions underlying the forward-looking statements that may be contained herein are believed to be reasonable they can be affected by inaccurate assumptions or by known or unknown risks and uncertainties. AAM assumes no duty to provide updates to any analysis contained herein. A complete list of investment recommendations made during the past year is available upon request. Past performance is not an indication of future returns. This information is distributed to recipients including AAM, any of which may have acted on the basis of the information, or may have an ownership interest in securities to which the information relates. It may also be distributed to clients of AAM, as well as to other recipients with whom no such client relationship exists. Providing this information does not, in and of itself, constitute a recommendation by AAM, nor does it imply that the purchase or sale of any security is suitable for the recipient. Investing in the bond market is subject to certain risks including market, interest-rate, issuer, credit, inflation, liquidity, valuation, volatility, prepayment and extension. No part of this material may be reproduced in any form, or referred to in any other publication, without express written permission.