insight
AAM Corporate Credit View: June 2011
June 9, 2011
How Important Are The Autos?
Investment grade corporate bond spreads widened last month, producing -39 basis points (bps) of excess return, as the OAS of the Barclays Corporate Index widened 8 bps. Performance year-to-date as of May 31 remains strongly positive (109 bps of excess return). Despite the spread widening, prices moved higher as Treasury yields fell by a greater amount given the flight to quality. Companies took advantage of the falling Treasury yields, issuing $80 billion of investment grade debt in May for a year-to-date total of $333 billion. We had been expecting $565 billion to be issued this year, and while we may revise our estimate higher, we do not expect the current pace will continue. Positively, demand for new issues remains very high as exemplified by the over subscription of deals. The magnitude of spread widening was modest considering the heavy issuance (i.e., May 2010 was $23 billion), disappointing economic data releases around the world (mainly U.S. and China), and the European debt crisis. In the second half of 2011, we expect the economic data releases to improve as industrial production related to Japan returns and gas prices remain below $4/gallon. We continue to believe that spreads will be range bound and exit the year posting positive excess returns.
The impact of the Japanese earthquake and tsunami in March of this year on the U.S. manufacturing segment was evident in the most recent release of monthly auto sales. We believe this increased the downside risk for growth in the U.S. but only on a temporary basis. The auto industry is a meaningful contributor to GDP, accounting for 1.4 percentage points[1] of the first quarter GDP growth of 1.8%. After reviewing the May employment report that showed motor vehicle hours worked and regressing the data against motor vehicle production, Deutsche Bank revised an earlier estimate of the reduction in GDP growth for the second quarter related to the autos from 0.5 – 0.75 percentage points[2] to 1.5 – 2.0 percentage points[3]. They anticipate that auto production for the second quarter could be the largest drop on record, larger than the -23% in the first quarter of 2009, the peak of the recession.
Exhibit 1
| Japanese vs. US Auto OEMs | ||||
| 2010 Unit Sales | % Parts Manufactured in Japan | % Produced in U.S. | % Produced in Japan | |
| Japanese | ||||
| Honda | 1,230,480 | 87% | 13% | |
| Nissan | 908,570 | 68% | 32% | |
| Toyota | 1,763,595 | 67% | 33% | |
| Other | 574,753 | 34% | 64% | |
| TOTAL | 4,477,398 | 20% | 68% | 31% |
| Detroit 3 | 5,227,410 | 5% | ||
Source: AAM, Ward’s, Bank of America, Goldman Sachs
While it varies by manufacturer, a significant portion of Japanese cars sold in the U.S. are produced in Japan, and importantly, 20% of the parts are sourced from Japan vs. 5% for U.S. car manufacturers (Exhibit 1). A number of auto parts manufacturers in Japan slowed the production process in the U.S. because key auto components (especially electrical) were not available to complete the assembly of certain cars.
This disruption has resulted in a very low level of inventories. The days supply of inventory for the Japanese Original Equipment Manufacturers (OEMs) was 42 days down from 49 days in April and well below the five year average for May of 50 days. Key models were down to alarming levels, including 27 days for the Honda Civic and 30 days for the Toyota Corolla. This compares with 59 days supply in May for the “Detroit 3” (Ford, GM, Chrysler)[4]. To avoid running out of stock, manufacturers pulled back auto incentives (Exhibits 2 and 3). Accordingly, the
Exhibit 2: U.S. Auto Growth vs. Incentive Growth
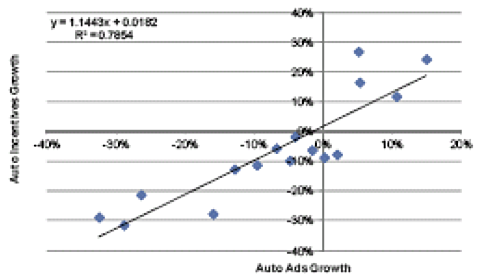
Source: Autodata, Kantar Media, Goldman Sachs Research
Exhibit 3: Growth Year Over Year in Incentives Per Vehicle Sold
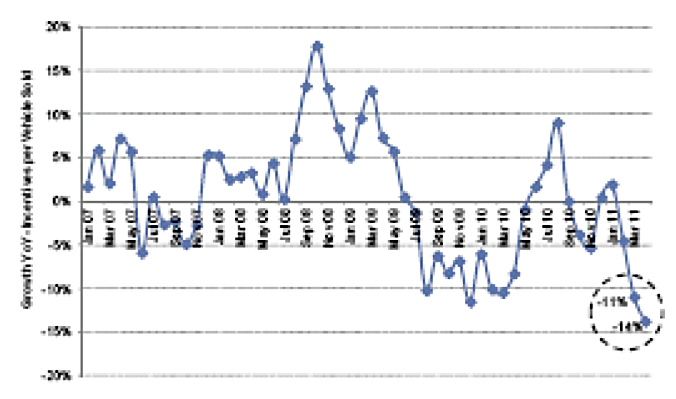
Source: Autodata, Goldman Sachs Research
market share for the Japanese OEMs, which includes Toyota, Honda, and Nissan, fell to the lowest level in over five years in May (Exhibit 4). The Detroit 3 have taken advantage of the current situation in hopes of regaining legacy share.
Exhibit 4
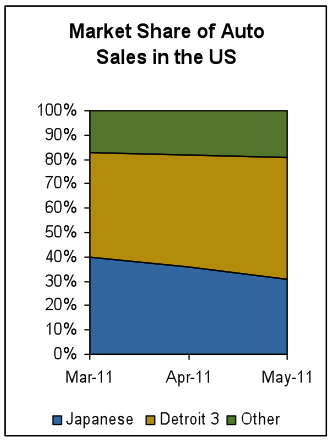
Source: Bloomberg
In addition to the lack of incentives, we believe high gas prices have also impacted car sales. There has been a clear change in the mix given the lower percentage of sales to large pickups and Sports Utility Vehicles (SUVs) vs. more fuel efficient vehicles. We witnessed this same trend when gas prices were at comparable levels in mid-2008. In the meantime, consumers are absorbing price increases related to rising commodity prices and reading that their home values continue to fall. Therefore, the one-two-punch of rising prices and falling home values, negatively affected consumer sentiment, delaying the purchase of new cars. The title of a news article from the Los Angeles Times best reflects this sentiment: “Best Option for Car Shoppers: Postpone Buying” (May 22, 2011).
At this point, for 2011, we are optimistic that auto sales will resume and reach 13 million Seasonally Adjusted Annual Rate (SAAR), which is still well below the long-term average, as problems in the second quarter seemed to have stemmed from a natural disaster as opposed to economic fundamentals. We would expect buyers to defer their auto purchases towards the latter part of 2011, as inventories begin to normalize, prices recede, and 2012 models are introduced. Toyota and Honda have both been working extremely hard to get their production back in-line with normal levels. Toyota recently announced that production in Japan will be at 90% of normal levels in June, that it would increase production at its thirteen North America plants to 70% of capacity from 30% previously, as parts shortages are less severe than first expected, and that it would move to 100% production in North America on eight models. Similarly, Honda announced that production in North America will be at 100% of original plan by August, with the exception of the 2012 Civic. This should cause an acceleration of manufacturing activity, and put the economy back on track.
If the economy continues to slow or gas prices spike once again, we would not expect auto sales to reach our goal of 13 million SAAR. That said, we do not expect gas prices to rise unless Middle East tension increases or economic growth is higher than expected (which should be a positive for auto sales). Rising gasoline prices sapped household spending power by approximately $100 billion over the last five months[5], but have been trending lower along with the price of oil (Exhibit 5). Our 2011 forecast for oil is for $90/barrel (bbl) West Texas Intermediate (WTI), currently $100.50/bbl, both of which should result in gas prices less than the $3.96/gallon averaged in May.
Exhibit 5
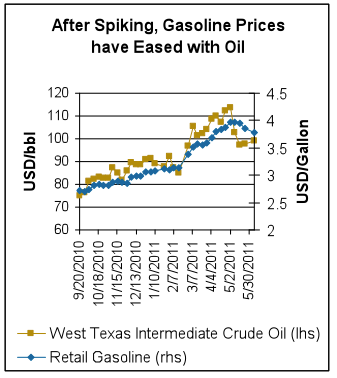
Source: Energy Information Administration
Written by:
Elizabeth G. Henderson, CFA
Director of Corporate Credit
Michael J. Ashley
Vice President, Corporate Credit
Disclaimer: Asset Allocation & Management Company, LLC (AAM) is an investment adviser registered with the Securities and Exchange Commission, specializing in fixed-income asset management services for insurance companies. This information was developed using publicly available information, internally developed data and outside sources believed to be reliable. While all reasonable care has been taken to ensure that the facts stated and the opinions given are accurate, complete and reasonable, liability is expressly disclaimed by AAM and any affiliates (collectively known as “AAM”), and their representative officers and employees. This report has been prepared for informational purposes only and does not purport to represent a complete analysis of any security, company or industry discussed. Any opinions and/or recommendations expressed are subject to change without notice and should be considered only as part of a diversified portfolio. A complete list of investment recommendations made during the past year is available upon request. Past performance is not an indication of future returns.
This information is distributed to recipients including AAM, any of which may have acted on the basis of the information, or may have an ownership interest in securities to which the information relates. It may also be distributed to clients of AAM, as well as to other recipients with whom no such client relationship exists. Providing this information does not, in and of itself, constitute a recommendation by AAM, nor does it imply that the purchase or sale of any security is suitable for the recipient. Investing in the bond market is subject to certain risks including market, interest-rate, issuer, credit, inflation, liquidity, valuation, volatility, prepayment and extension. No part of this material may be reproduced in any form, or referred to in any other publication, without express written permission.
[1] Reuters, “Japan earthquake impact on US autos may dent US GDP” 5/19/2011
[2] Reuters, “Japan earthquake impact on US autos may dent US GDP” 5/19/2011
[3] LaVorgna, Joseph, Deutsche Bank “Quantifying the impact of autos on Q2 real GDP” 6/6/2011
[4] Kohei Takahashi, JP Morgan, page 5, “US Inventory & Incentive Flash (May)”, 6/3/11
[5] LaVorgna, Joseph, Deutsche Bank “US Daily Economic Notes” 06/01/2011
Disclaimer: Asset Allocation & Management Company, LLC (AAM) is an investment adviser registered with the Securities and Exchange Commission, specializing in fixed-income asset management services for insurance companies. Registration does not imply a certain level of skill or training. This information was developed using publicly available information, internally developed data and outside sources believed to be reliable. While all reasonable care has been taken to ensure that the facts stated and the opinions given are accurate, complete and reasonable, liability is expressly disclaimed by AAM and any affiliates (collectively known as “AAM”), and their representative officers and employees. This report has been prepared for informational purposes only and does not purport to represent a complete analysis of any security, company or industry discussed. Any opinions and/or recommendations expressed are subject to change without notice and should be considered only as part of a diversified portfolio. Any opinions and statements contained herein of financial market trends based on market conditions constitute our judgment. This material may contain projections or other forward-looking statements regarding future events, targets or expectations, and is only current as of the date indicated. There is no assurance that such events or targets will be achieved, and may be significantly different than that discussed here. The information presented, including any statements concerning financial market trends, is based on current market conditions, which will fluctuate and may be superseded by subsequent market events or for other reasons. Although the assumptions underlying the forward-looking statements that may be contained herein are believed to be reasonable they can be affected by inaccurate assumptions or by known or unknown risks and uncertainties. AAM assumes no duty to provide updates to any analysis contained herein. A complete list of investment recommendations made during the past year is available upon request. Past performance is not an indication of future returns. This information is distributed to recipients including AAM, any of which may have acted on the basis of the information, or may have an ownership interest in securities to which the information relates. It may also be distributed to clients of AAM, as well as to other recipients with whom no such client relationship exists. Providing this information does not, in and of itself, constitute a recommendation by AAM, nor does it imply that the purchase or sale of any security is suitable for the recipient. Investing in the bond market is subject to certain risks including market, interest-rate, issuer, credit, inflation, liquidity, valuation, volatility, prepayment and extension. No part of this material may be reproduced in any form, or referred to in any other publication, without express written permission.