Favorable market technicals lead to strong performance and curve flattening bias
Following a strong performance in the fourth quarter of 2018, municipals once again experienced exceptional strength throughout the first quarter of 2019. A combination of weaker than expected economic data and dovish commentary from the Federal Reserve prompted 10yr Treasuries to rally by 28 basis points (bps) during the quarter. However, most of the positive performance in Treasuries was concentrated in March, with rates in 10yrs falling by 31bps.
Strong and even performance
For the municipal sector, strong performance in the sector was more evenly distributed throughout the quarter as supply/demand imbalances pressured yields lower across the yield curve. Heavier demand was expected as a result of the exceptional levels of reinvestment flows from coupons/calls/maturities, which are at the second highest level of the year during January and February. However, subdued supply levels, both in the secondary and the new issue market, have exacerbated the imbalances that are typically in place during the first quarter.
Secondary supply
In looking at secondary supply, broker/dealer inventory levels to start the year were at very low levels. According to data provided by the Federal Reserve, fixed-rate bonds with maturities 10yrs and shorter were reported 30% below the 1-year average at ~$4.5 Billion. As retail investors early in the quarter were still concerned about the volatility in interest rate levels, demand from these investors remained concentrated inside of 10yrs. That demand helped push inventory levels to a 2-year low of $3.75B on March 6th, and pressured yields lower in 5yr and 10yr maturities by 27 and 18bps, respectively, through the end of February.
Demand would extend further out the curve into the 15 to 30yr area on the heels of disappointing economic data and FOMC commentary that they would likely halt further rate hikes for the balance of 2019. The resulting Treasury rally and reduced investor concerns about rising rates compelled investor to take advantage of the steepness in the muni curve. Additionally, supply technicals continued to provide support as new issuance levels during March came in at 27% below expectations. Per data reported by Thomson Reuter’s Municipal Market Data, these positive developments lead to 20 and 30yr muni rates to fall by 37 and 38bps, respectively. The rally also resulted in the muni yield curve from 2 to 20yrs to flatten by 25bps during March.
Looking ahead
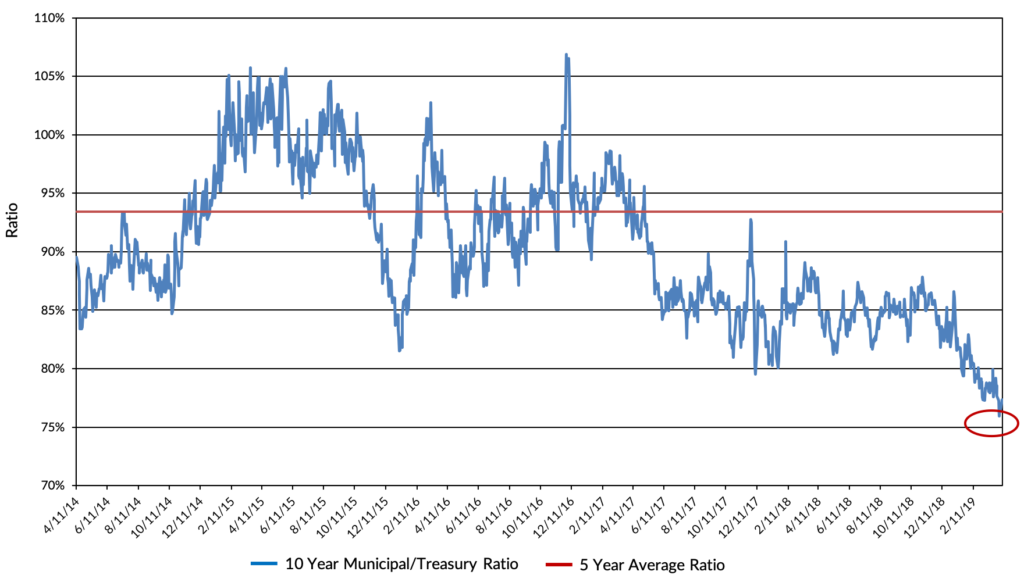
With the strong performance for the sector, relative valuation levels across the curve now look expensive, especially 7yrs and longer. In both the 10yr and 20yr areas of the yield curve, municipal-to-Treasury ratios ended the quarter at or near 5-year lows of 77% and 93%, respectively. Current supply levels could provide near-term support for these relative valuations levels. Broker/dealer Inventories remain light, with levels for maturities 10yrs and longer ending the quarter down 25% from January 1stand 26% below the 1-year average. Additionally, demand looks very solid. Mutual fund inflows, as reported by Lipper, were running at a record pace during the first quarter, with an average of almost $2 Billion per week. However, with 10yr and longer rates falling by over 40bps during the quarter, we could see a pickup in issuance from refinancing supply during an April-to-June period that historically is the highest issuance period of the year. Our outlook for the sector over the next quarter is to expect some weakness from current expensive relative valuations and we are advocating selling into the current market strength and sector-rotating into the taxable sectors.
Exhibit 1: Yield Curve Slope Analysis
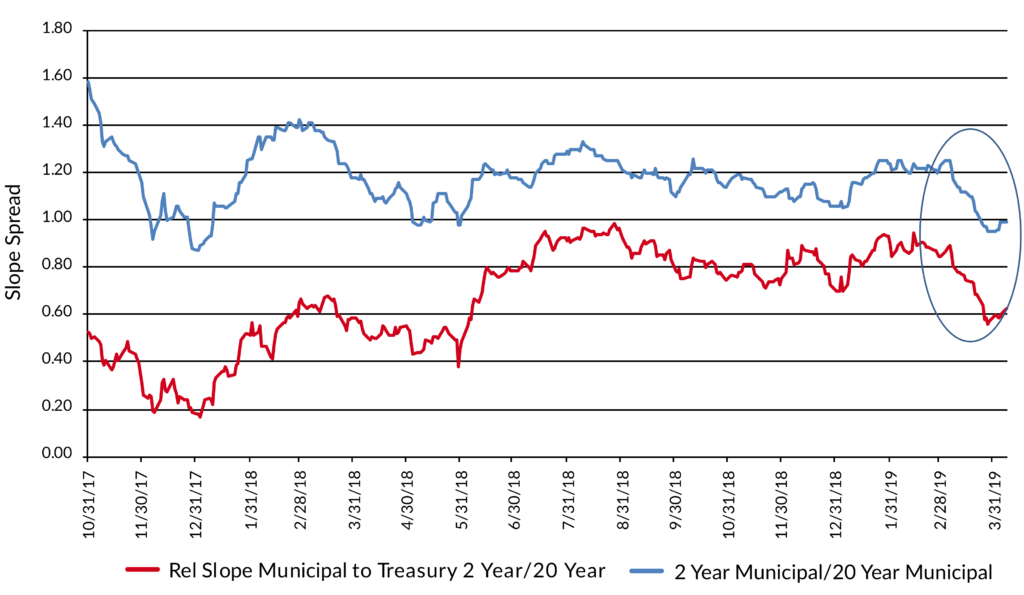
Exhibit 2: 10 Year Municipal/Treasury Yield Ratio
Source: Thomson Reuters, Federal Reserve Bank of New York, Bloomberg, Lipper US Fund Flows
Disclaimer: Asset Allocation & Management Company, LLC (AAM) is an investment adviser registered with the Securities and Exchange Commission, specializing in fixed-income asset management services for insurance companies. Registration does not imply a certain level of skill or training. This information was developed using publicly available information, internally developed data and outside sources believed to be reliable. While all reasonable care has been taken to ensure that the facts stated and the opinions given are accurate, complete and reasonable, liability is expressly disclaimed by AAM and any affiliates (collectively known as “AAM”), and their representative officers and employees. This report has been prepared for informational purposes only and does not purport to represent a complete analysis of any security, company or industry discussed. Any opinions and/or recommendations expressed are subject to change without notice and should be considered only as part of a diversified portfolio. Any opinions and statements contained herein of financial market trends based on market conditions constitute our judgment. This material may contain projections or other forward-looking statements regarding future events, targets or expectations, and is only current as of the date indicated. There is no assurance that such events or targets will be achieved, and may be significantly different than that discussed here. The information presented, including any statements concerning financial market trends, is based on current market conditions, which will fluctuate and may be superseded by subsequent market events or for other reasons. Although the assumptions underlying the forward-looking statements that may be contained herein are believed to be reasonable they can be affected by inaccurate assumptions or by known or unknown risks and uncertainties. AAM assumes no duty to provide updates to any analysis contained herein. A complete list of investment recommendations made during the past year is available upon request. Past performance is not an indication of future returns. This information is distributed to recipients including AAM, any of which may have acted on the basis of the information, or may have an ownership interest in securities to which the information relates. It may also be distributed to clients of AAM, as well as to other recipients with whom no such client relationship exists. Providing this information does not, in and of itself, constitute a recommendation by AAM, nor does it imply that the purchase or sale of any security is suitable for the recipient. Investing in the bond market is subject to certain risks including market, interest-rate, issuer, credit, inflation, liquidity, valuation, volatility, prepayment and extension. No part of this material may be reproduced in any form, or referred to in any other publication, without express written permission.