The medical professional liability (MPL) industry is in a period of transition. A protracted era of strong and stable underwriting has had its margins slowly depleted by soft pricing, with the median MPL insurer facing a net underwriting loss in 2016-2018, after years of consistent profits. The historical pattern of conservative reserving practices leading to a tailwind of consistent positive development has moderated, and total premium volume has leveled off, due in part to continuing consolidation of healthcare providers, in the wake of the Affordable Care Act.
Contributing factors
How MPL insurers will respond to this environment remains to be seen. While they are generally profitable and very well capitalized (the ratio of premiums to surplus has fallen from 53% in 2010 to 33% in 2018), they are unlikely to tolerate persistent underwriting losses for very long. Given limited opportunities for growing policy volume, the issue will come down to their inclination and ability to finally raise rates after years of relative stagnation.
On the one hand, MPL is a competitive industry with many monoline players competing for market share, so this could be a difficult proposition. On the other hand, many carriers emphasize high levels of customer service and longstanding relationships with their insureds, which could afford them some leeway in adjusting rates, without sparking the same sorts of loss of customers that one would see in more commoditized sectors like private auto.
Forthcoming effects
One possible outcome is that we may see some participants consolidate, change their legal capital structure, or exit the marketplace altogether. For example, in New York, Berkshire Hathaway recently completed the demutualization of Medical Liability Mutual Insurance Company, and The Doctors Company is purchasing Hospitals Insurance Company, while other carriers are restructuring and using assessments to offset lost premium. We identify five monoline MPL insurers founded in 2013, none in 2014, one in 2015, five in 2016, and two in 2017. Meanwhile, only one has ceased ongoing operations during this period, due to declining capitalization.
The MPL industry has faced a trend of declining reserve releases, rising loss ratios, declining premium growth, declining investment returns, and declining returns to surplus for many years. However, in 2017 the industry finally seemed to reach an inflection point, and results for 2018 at least partially support the idea that these trends may now be reversing.
MPL data
The balance of this article presents a graphical overview of recent financial performance across MPL insurers and explains why their fortunes may be changing for the better, though difficult choices remain.
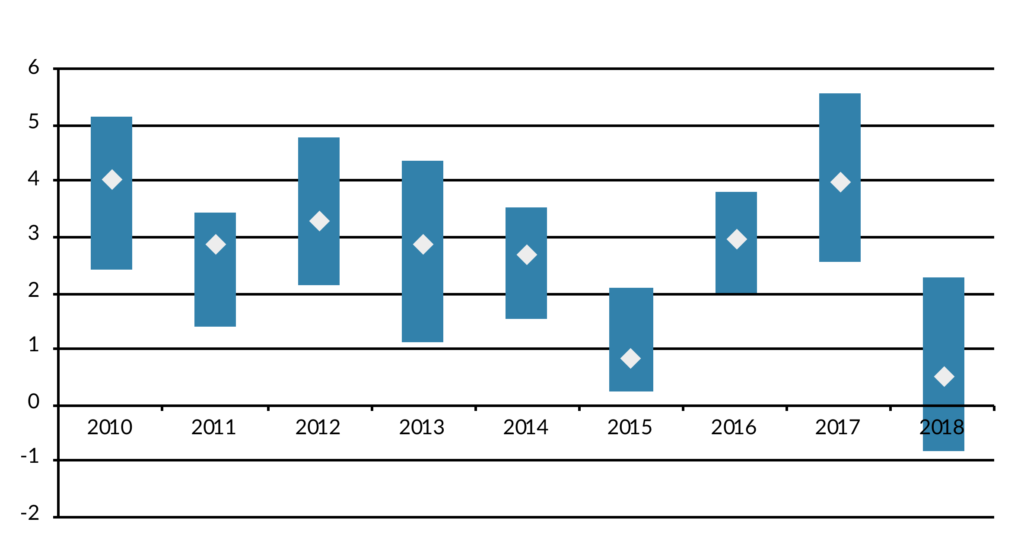
Figure 1 shows the relationship of returns to surplus for a broad composite of 97 property/casualty (P/C) insurers writing primarily MPL coverage, indicating the 25th-75th percentile range and median for each year. As you can see, returns have shown a pattern of consistent decline over time. We attribute this to three underlying factors: slowing premium growth due to limited capacity to increase rates in a mature market, diminished benefit to underwriting gains from favorable reserve development, and reduced investment returns due to low-fixed income reinvestment rates.
Figure 1: Returns on Surplus
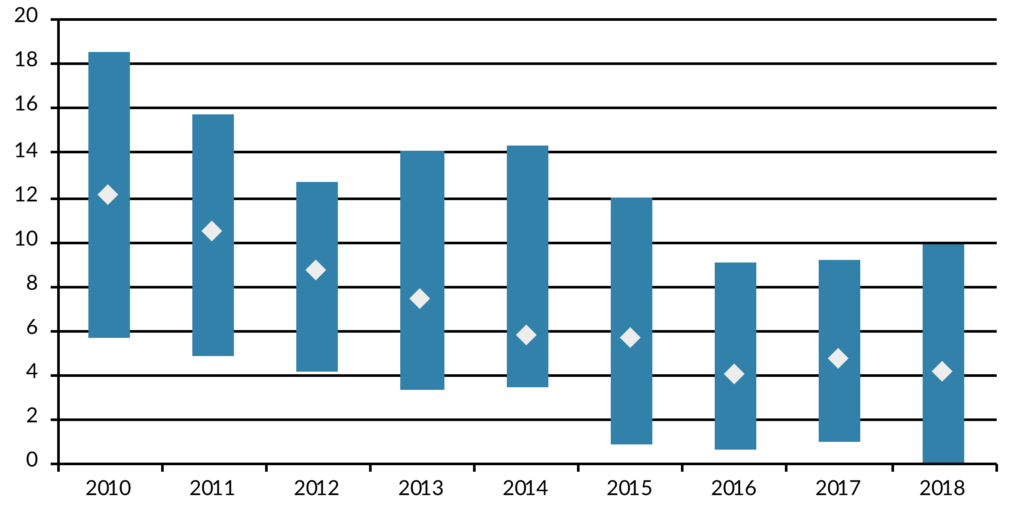
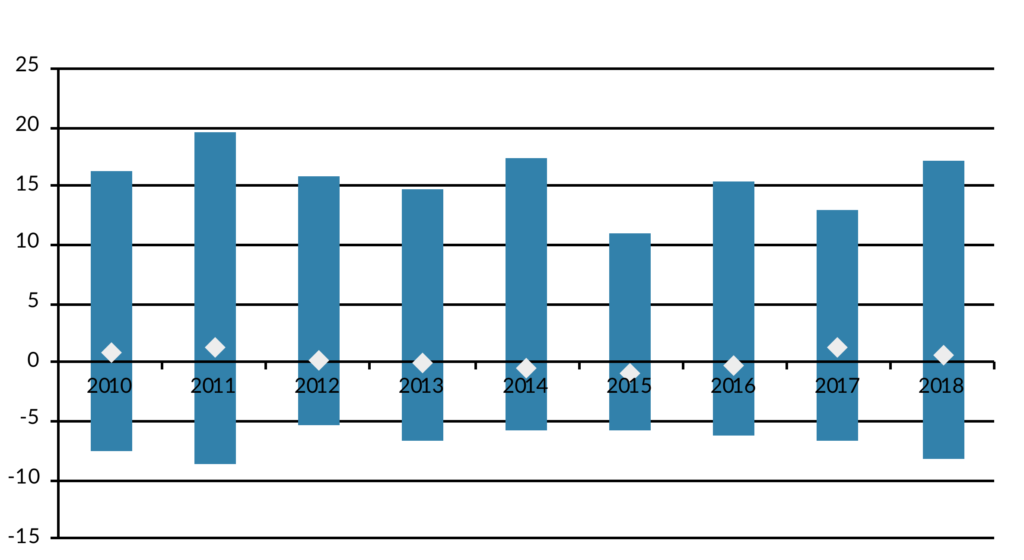
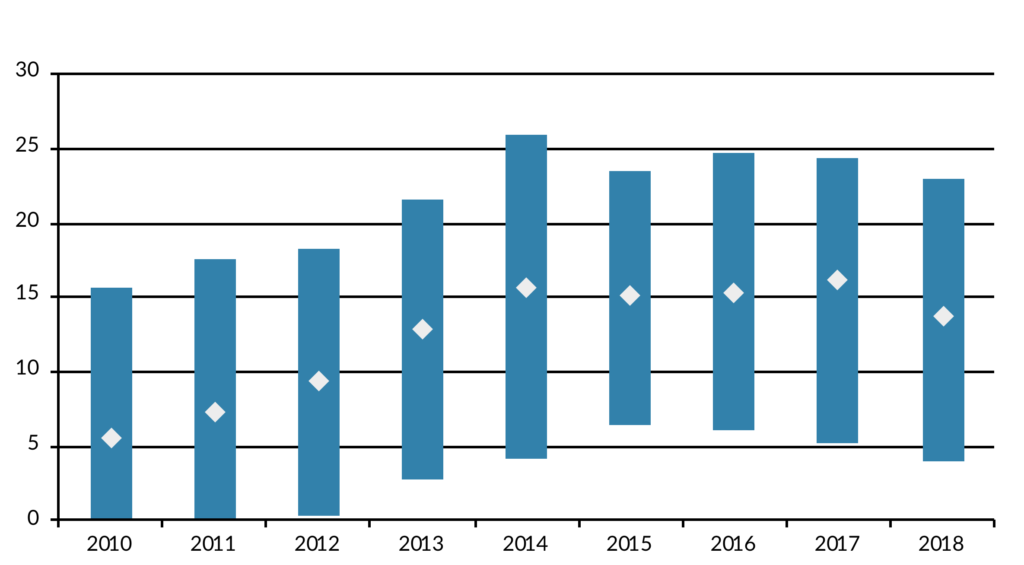
After consistent declines since 2010, median returns have stabilized at 4-5% and even show signs of recovery. We will see this pattern across many of the statistics we examine. One factor is a modest turnaround in premium volume noted in 2017 (Figure 2) after several years of declines, thanks to strengthening economic conditions.
Figure 2: Growth in Net Written Premium
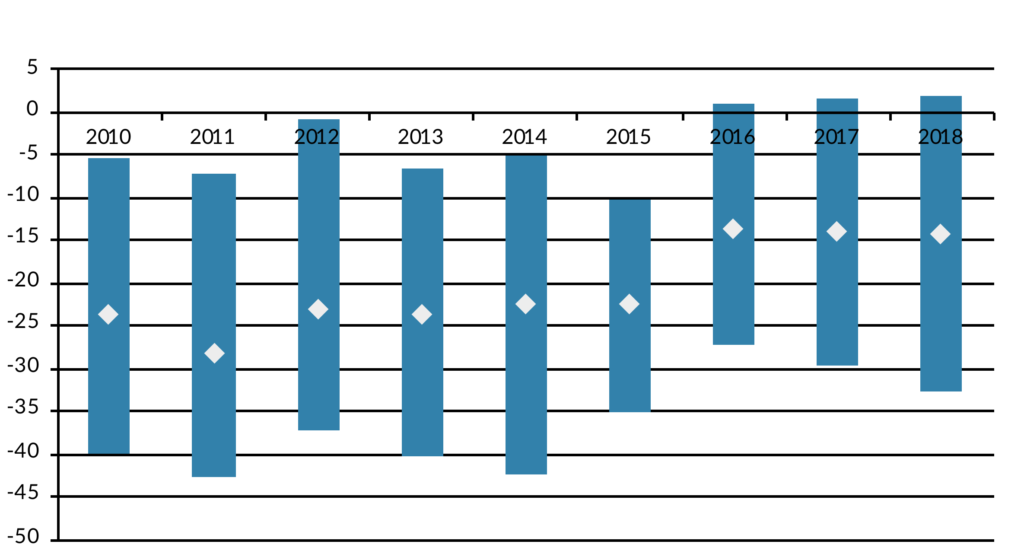
Meanwhile on the reserving side, the trend of consistent favorable development each year, which served as the foundation of strong underwriting returns in many recent years, has stabilized (Figure 3), after years of shrinking (less negative = less favorable) reserve releases.
Figure 3: One-Year Reserve Development Divided by Net Premium Earned
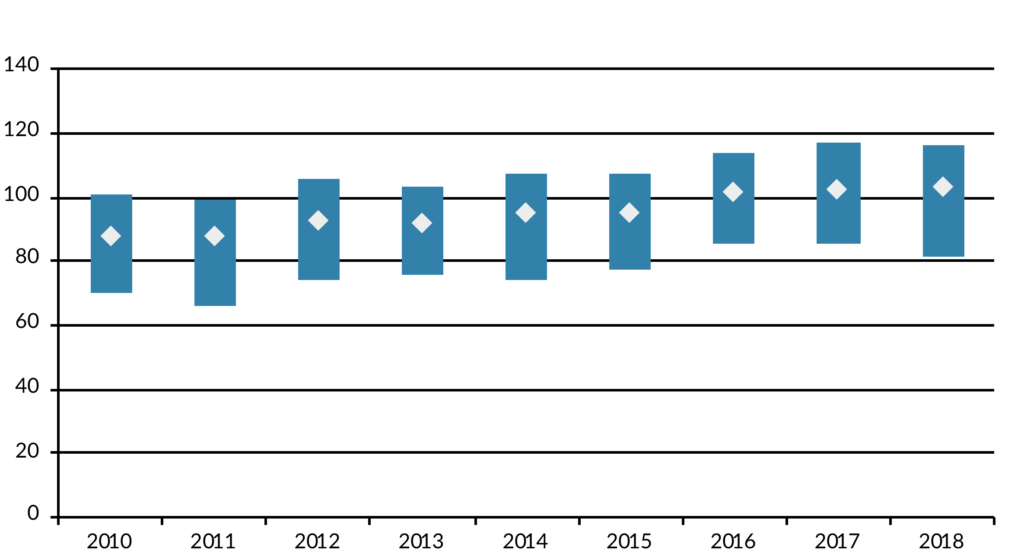
This, in turn, led to a gradual decline in underwriting margin over time, though, once again, we see a pattern of apparent stabilization in the 2017-2018 timeframe (Figure 4).
Figure 4: Combined Ratios
The investment side
On the investment side, MPL insurers have faced the same declining book yield on fixed-income investments – due to low reinvestment rates – that have affected the whole industry. This has been partly offset by generally strong equity returns ever since the 2008 financial crisis. Figure 5 includes total investment returns for each year (specifically: investment income, realized gains/losses, and unrealized gains/losses marked to surplus below the line) as a percentage of total invested assets, illustrating the downward trend in investment income, but also the strong equity effect from e.g. 2017 (Figure 5).
Figure 5: Total Investment Return (as a Percent of Investments)
The good news on this front is that reinvestment rates have begun to rise over the last couple of years amid Fed rate hikes and a gradually accelerating economy. The gross bond yield for our composite bottomed at 2.53% in 2016 and rose to 2.85% in 2018. Median equity exposure also tripled between 2010 and 2015, remaining relatively stable thereafter (Figure 6) until declining in Q4 2018 due to market volatility.
Figure 6: Unaffiliated Equity Divided by Investments
Conclusion: things are improving, but challenges persist
In summary, MPL insurers can look forward to ongoing improvements in earnings derived from favorable reinvestment yields, a welcome development that has been many years in coming. However, the increasingly challenging underwriting environment for this mature sector has brought an end to the era of reliable combined ratios in the range of 85% to 95% for many participants, though in the last couple of years these metrics have begun to stabilize. Whether this ultimately leads to pricing adjustments, consolidation, changes in market structure, or other developments will be key to watch going forward.
For related information please contact:
Neelm Hameer – Vice President of Business Development
neelm.hameer@aamcompany.com
John Olvany – Vice President of Business Development john.olvany@aamcompany.com
Disclaimer: Asset Allocation & Management Company, LLC (AAM) is an investment adviser registered with the Securities and Exchange Commission, specializing in fixed-income asset management services for insurance companies. Registration does not imply a certain level of skill or training. This information was developed using publicly available information, internally developed data and outside sources believed to be reliable. While all reasonable care has been taken to ensure that the facts stated and the opinions given are accurate, complete and reasonable, liability is expressly disclaimed by AAM and any affiliates (collectively known as “AAM”), and their representative officers and employees. This report has been prepared for informational purposes only and does not purport to represent a complete analysis of any security, company or industry discussed. Any opinions and/or recommendations expressed are subject to change without notice and should be considered only as part of a diversified portfolio. Any opinions and statements contained herein of financial market trends based on market conditions constitute our judgment. This material may contain projections or other forward-looking statements regarding future events, targets or expectations, and is only current as of the date indicated. There is no assurance that such events or targets will be achieved, and may be significantly different than that discussed here. The information presented, including any statements concerning financial market trends, is based on current market conditions, which will fluctuate and may be superseded by subsequent market events or for other reasons. Although the assumptions underlying the forward-looking statements that may be contained herein are believed to be reasonable they can be affected by inaccurate assumptions or by known or unknown risks and uncertainties. AAM assumes no duty to provide updates to any analysis contained herein. A complete list of investment recommendations made during the past year is available upon request. Past performance is not an indication of future returns. This information is distributed to recipients including AAM, any of which may have acted on the basis of the information, or may have an ownership interest in securities to which the information relates. It may also be distributed to clients of AAM, as well as to other recipients with whom no such client relationship exists. Providing this information does not, in and of itself, constitute a recommendation by AAM, nor does it imply that the purchase or sale of any security is suitable for the recipient. Investing in the bond market is subject to certain risks including market, interest-rate, issuer, credit, inflation, liquidity, valuation, volatility, prepayment and extension. No part of this material may be reproduced in any form, or referred to in any other publication, without express written permission.