insight
Performance Matters – Analyzing Investment Manager Performance Results
May 1, 2019
Download PDFA glimpse at investment manager performance results versus the Bloomberg Barclays U.S. Aggregate Index
The simplest way to evaluate an investment manager is to review past performance relative to a stated benchmark. Benchmark outperformance is the gold standard in investment management, but the amount of outperformance can differ greatly depending on manager philosophy and strategy. A blanket statement of outperformance alone cannot verify that one manager is superior to another. The level of outperformance relative to a benchmark is key to determining the top investment manager by performance results. Additionally, a survey of approximately 124 investment firms conducted by Investment Metrics, LLC tells us that a plain vanilla, passive fixed income strategy will produce outperformance over the Bloomberg Barclays U.S. Aggregate Index over a market cycle.
Ten-year data suggests that investment manager performance differs greatly upon active portfolio management strategies. The survey of manager performance, by Investment Metrics, LLC, is ranked by quartile versus the Bloomberg Barclays U.S. Aggregate Index in Exhibit 1. The U.S. Aggregate Index falls in the bottom quartile of managers over the last 3, 5, and 10 year time periods. Last year was the exception when the U.S. Aggregate Index was in the 3rd quartile after volatility returned to the markets and a flight to quality was observed. Both sector allocation decisions and yield enhancements play a major role in the variability of quartile outperformance versus the U.S. Aggregate Index.
Exhibit 1: Bloomberg Barclays U.S. Aggregate Returns vs. Peer Group – as of 3/31/2019
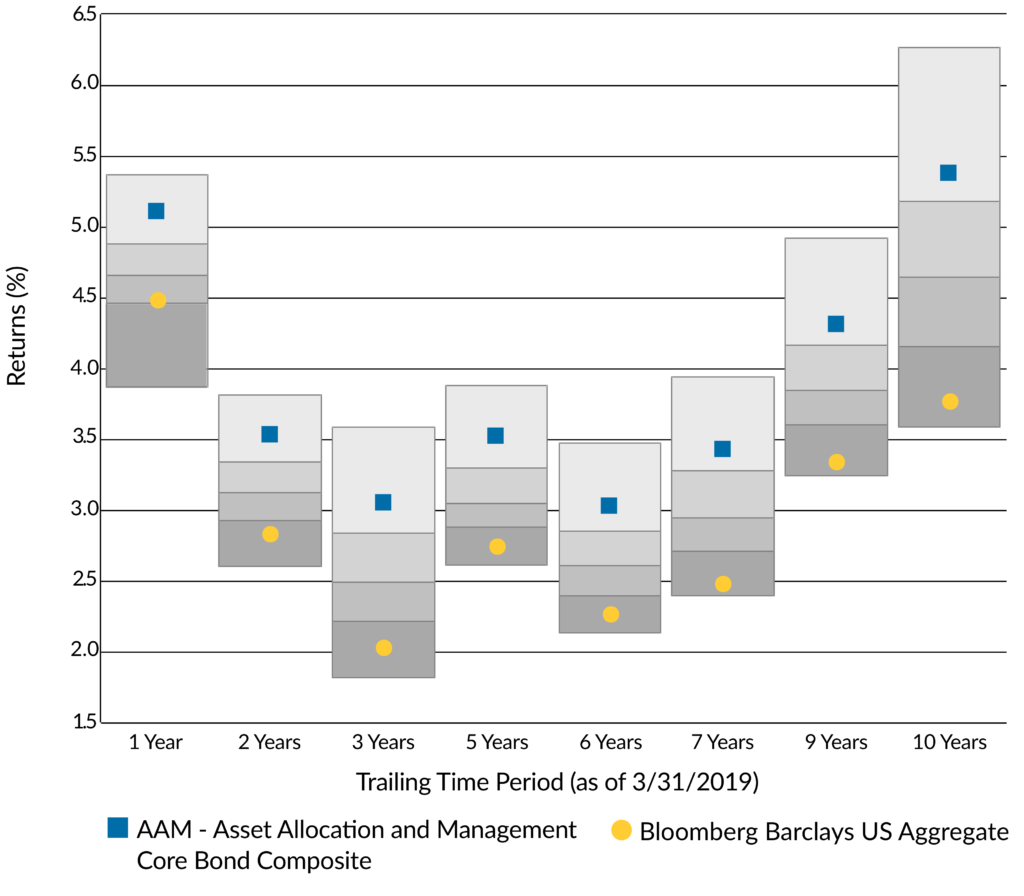
AAM Core Bond Composite includes 8 portfolios and $2,422 million in AUM.
Peer group based on IM U.S Broad Market Core Fixed Income (SA + CF) which includes 200 firms and 273 products.
The advantage of active sector selection and rotation
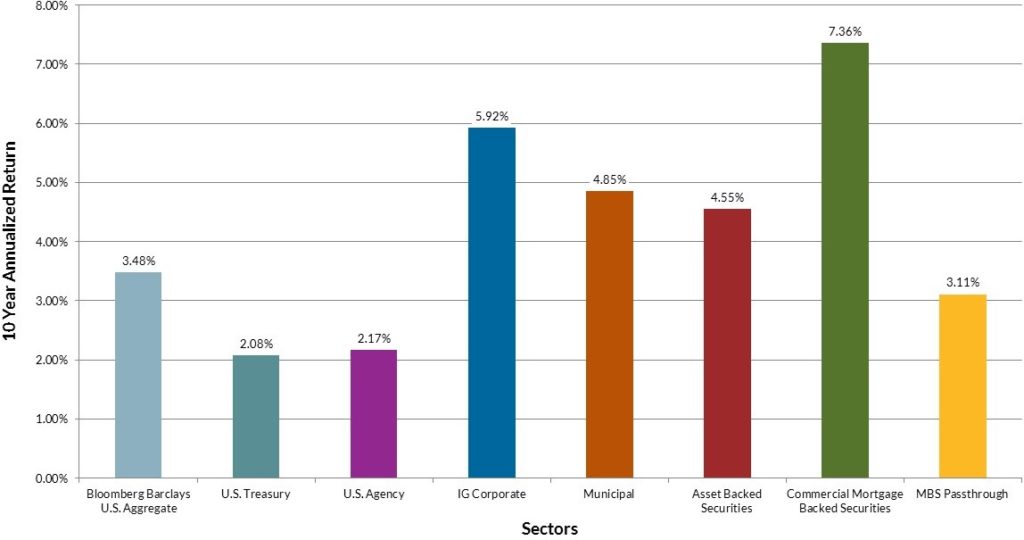
As presented in Exhibit 2, the Bloomberg Barclays U.S. Aggregate Index is inadequately diversified by investment grade sectors with U.S. Treasuries, MBS Passthroughs, and Investment Grade Corporate Bonds comprising over 90% of the index. The conservative allocation consists of a 39% weight to U.S. Treasuries, the worst performing fixed income sector over a 10 year period (Exhibit 3). MBS Passthroughs are the second largest allocation in Index (28%) and the third worst performing sector over the same time period. An active investment manager who opted to underweight U.S. Treasuries and MBS Passthroughs and overweight IG Corporate Bonds, Commercial Mortgage Backed Securities and Asset Backed Securities over the 10 year time period handily outperformed the U.S. Aggregate Index. The variability in quartile outperformance in the Investment Metrics, LLC survey can be determined by both the underweight and overweight given to each sector. Conversely, in periods of high volatility exhibited in late 2018, an overweight to U.S. Treasuries produced more favorable investment results than in periods of low volatility, causing the U.S. Aggregate Index to rise into the 3rd quartile over the 1 year period (Exhibit 1). Security selection and active sector rotation within the top performing, higher yielding fixed income sectors further differentiates the top quartile of managers from the bottom.
Exhibit 2: Bloomberg Barclays U.S. Aggregate Sector Allocation
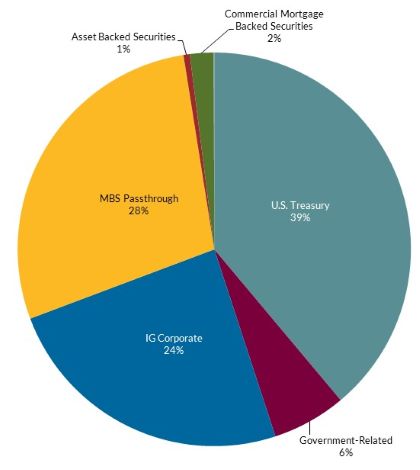
Exhibit 3: 10 Year Annualized Return
Since the U.S. Aggregate Index falls in the bottom quartile of managers, a manager claiming outperformance versus the Index can fall in a range of the bottom quartile to the top quartile. Retaining a bottom quartile performance manager versus a top quartile manager will cost an investor on average approximately 200bps of annualized total return over a 10 year period, or roughly $2 million annually for a $100 million fixed income portfolio (Exhibit 4). The cumulative difference is more staggering at $21 million for the same $100 million portfolio over the 10 year period. The primary determinants of top quartile performance depends immensely on investment manager philosophy, active sector rotation, security selection, and duration management.
Exhibit 4: Bloomberg Barclays U.S. Aggregate Returns vs. Peer Group Averages
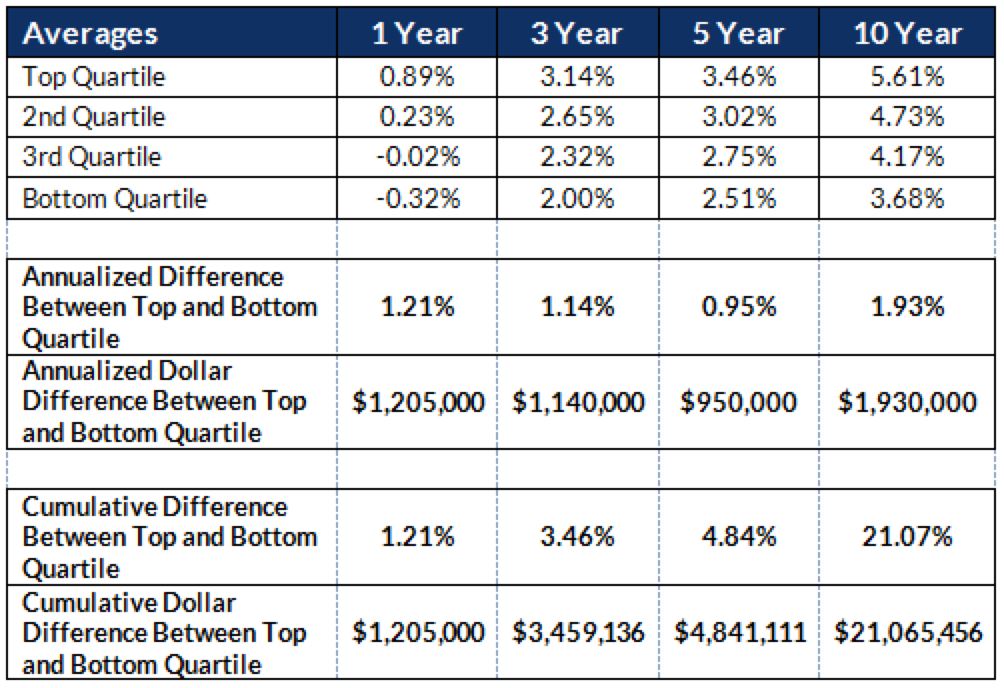
Dollar difference calculated using $100 million portfolio market value.
At AAM, we recognize that insurance portfolios require a yield orientation within a risk-controlled framework that minimizes credit impairments and delivers a competitive total return over a market cycle. We seek to add value by identifying the best risk adjusted sectors and securities across the yield curve. Duration management is a key component of the investment process and portfolios are managed to a target duration as determined by the benchmark or the duration of liabilities. Implementing the strategy successfully results in proven competitive total returns over time as demonstrated in AAM’s top quartile performance relative to the peer group over the last 1, 3, 5, and 10 year periods (Exhibit 1). AAM’s Core Bond Composite is made up of 9 insurance client portfolios with assets totaling $2.4 billion, benchmarked to the Bloomberg Barclays U.S. Aggregate Index.
Investing for insurance companies is AAM’s sole organizational focus and our competitive advantage is our emphasis in utilizing a portfolio management and research team that is highly experienced and focused on avoiding negative credit events. The firm’s team of senior managers averages 28 years of investment industry experience, with the portfolio management team averaging 22 years of investment industry experience. Additionally, AAM’s size allows us to take advantage of market opportunities and find creative ways to add income to insurance portfolios. Many of these opportunities are too small to be considered by larger competitors; examples include certain Taxable Municipal Bonds, Community Bank Debt, Private Placements, and various niches within the Asset Backed, Commercial Mortgage Backed, Non-Agency and Residential Mortgage markets. Our nimble size also allows us to trade freely within sectors without impacting markets or individual credits.
Yield advantages will produce superior performance results
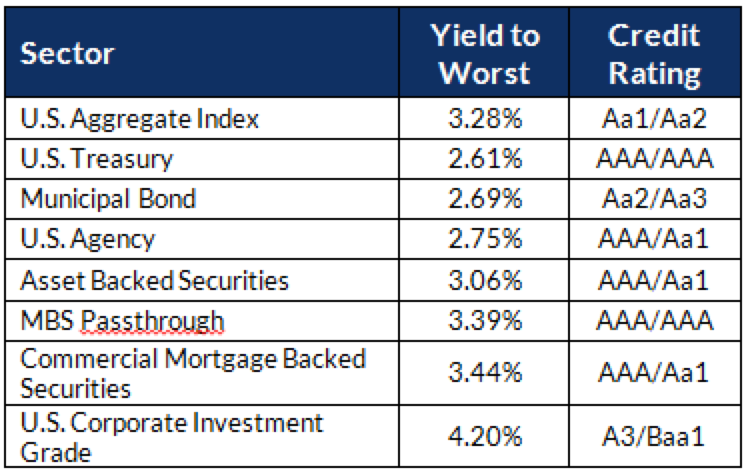
Using a yield orientation by identifying the best risk adjusted sectors and securities across the yield curve will result in an income advantage over the U.S. Aggregate Index and lead to greater total returns over time. Total return is defined as the sum of price return and income return, or fluctuations in market value and earned income on the underlying security. For example, the U.S. Treasury sector produced a yield of 2.6% as of year-end 2018, relative to the IG Corporate sector that produced a yield of 4.2% over the same period (Exhibit 5). If IG Corporate Bonds receive a 100% allocation versus U.S. Treasuries at 100%, the 1.6% yield differential will result in $1.6 million of additional income for a $100 million portfolio. Compounded income over time will lead to improved total return in the long run. When comparing multiple investment managers, the highest yielding manager will always have the best performance.
Exhibit 5: Yield to Worst for Taxable Sectors as of 12/31/2018
The results of the Investment Metrics, LLC survey display that a mediocre manager can easily outperform the U.S. Aggregate Index. Investment manager outperformance cannot simply be measured on a stand alone basis and does not guarantee that an investor will experience the best investment results. The difference in top quartile and bottom quartile manager performance should always be analyzed. Investment philosophy and strategy will largely determine how an investment manager performs relative to an index and its peers. A portfolio better diversified by investment grade sectors compared to the U.S. Aggregate Index, coupled with a yield enhancement will beat the Index over the long run. A top tier performance manager will always have the largest yield advantage. The difference in selecting a passive manager versus an active manager could cost an investor thousands, or even millions of dollars year over year.
Disclaimer: Asset Allocation & Management Company, LLC (AAM) is an investment adviser registered with the Securities and Exchange Commission, specializing in fixed-income asset management services for insurance companies. Registration does not imply a certain level of skill or training. This information was developed using publicly available information, internally developed data and outside sources believed to be reliable. While all reasonable care has been taken to ensure that the facts stated and the opinions given are accurate, complete and reasonable, liability is expressly disclaimed by AAM and any affiliates (collectively known as “AAM”), and their representative officers and employees. This report has been prepared for informational purposes only and does not purport to represent a complete analysis of any security, company or industry discussed. Any opinions and/or recommendations expressed are subject to change without notice and should be considered only as part of a diversified portfolio. Any opinions and statements contained herein of financial market trends based on market conditions constitute our judgment. This material may contain projections or other forward-looking statements regarding future events, targets or expectations, and is only current as of the date indicated. There is no assurance that such events or targets will be achieved, and may be significantly different than that discussed here. The information presented, including any statements concerning financial market trends, is based on current market conditions, which will fluctuate and may be superseded by subsequent market events or for other reasons. Although the assumptions underlying the forward-looking statements that may be contained herein are believed to be reasonable they can be affected by inaccurate assumptions or by known or unknown risks and uncertainties. AAM assumes no duty to provide updates to any analysis contained herein. A complete list of investment recommendations made during the past year is available upon request. Past performance is not an indication of future returns. This information is distributed to recipients including AAM, any of which may have acted on the basis of the information, or may have an ownership interest in securities to which the information relates. It may also be distributed to clients of AAM, as well as to other recipients with whom no such client relationship exists. Providing this information does not, in and of itself, constitute a recommendation by AAM, nor does it imply that the purchase or sale of any security is suitable for the recipient. Investing in the bond market is subject to certain risks including market, interest-rate, issuer, credit, inflation, liquidity, valuation, volatility, prepayment and extension. No part of this material may be reproduced in any form, or referred to in any other publication, without express written permission.