insight
Practical Methods for Valuing Fixed Income Securities to Derive a Fair Value Estimate
February 25, 2010
Executive Summary
As the reverberations from the Subprime Mortgage Crisis continue to impact the economy, capital markets and ultimately structured products securities, insurance companies face ongoing issues related to valuation guidance prescribed by the NAIC and FASB for these securities. While the Subprime Crisis has been well documented and vetted through the mainstream media, there has been a dearth of education for investors regarding appropriate and practical methods for valuing these fixed income securities, especially the scenario modeling of cash flows to derive a fair value estimate. The following discussion is divided into two parts. The first part provides a framework for constructing a cash flow.
Background
In September 2006, the Financial Accounting Standards Board (FASB) issued Statement of Financial Accounting Standards No. 157: Fair Value Measurements (FAS 157), which provided a universal framework for fair value estimations. The standard called for valuation to occur from an “exit” price standpoint, or the value a buyer would receive to sell an asset or paid to transfer a liability in an active market. Subsequently, the financial markets experienced the most significant recession since the 1930’s, causing a plethora of valuation difficulties as markets saw trading volume temper to the point of inactivity. These difficulties have caused FASB to make several modifications to FAS 157, which are now included within FASB Accounting Standards Codification (ASC) Topic 820 – Fair Value Measurements and Disclosures. Non-agency residential mortgage backed securities (nonagency RMBS) represent one particular market that has experienced these valuation issues. Insurers have traditionally been significant investors in RMBS and other asset-backed securities due to the historically attractive risk-adjusted yield opportunities. However, the housing market began to “bubble” as lending practices across the U.S. grew more creative while borrower classifications became more convoluted as further variability was introduced into borrowers’ rates. Ultimately, the “housing bubble” burst, causing these securitized pools of mortgage loans to lose significant value as homeowners continued to struggle to make mortgage payments, thus slowing, or in some cases ending, the cash flow to security holders. The financial crisis exposed the fact that many security owners may not have fully understood the securitization process and makeup of the mortgages underlying their investment. Financial reporting problems resulted across many industries and the accounting community called for accounting standards to further expand fair value and impairment definitions.
An Asset Manager’s Considerations in Analyzing RMBS by AAM
Mortgage loan characteristics:
Prior to a discussion on constructing a cash flow model, we thought it would be helpful to review the primary factors that will help determine the model’s inputs. The first factor to consider is the type of loan, which is generally categorized by the weighted average quality of the borrowers in the pool of mortgages being analyzed. The quality of the borrower is most often determined by the borrower’s credit rating or FICO score. While there are no universally established ranges for the various borrower credit classifications, a borrower with a FICO score of 720 or higher is generally considered a prime borrower. Alternative-A or Alt-A borrowers often include those who do not provide full documentation and generally have FICO scores ranging from mid 600’s to the low 700’s. A credit score below the mid 600’s is considered a subprime borrower. A breakdown of the credit scores for the loans backing a security is typically available for most non-agency RMBS in the monthly remittance data supplied by the servicer. As logic would dictate, a pool of mortgages backed by borrowers with lower weighted average credit scores will usually experience a higher rate of default, all other factors being equal.
The second factor to consider is the year of origination, or vintage, of the mortgages in the pool. During the recent housing cycle, home prices increased substantially across most of the United States from 2002 to 2007, peaking in mid 2006. As home prices subsequently declined, many borrowers who purchased homes near the peak in prices now owe more than their homes are worth (negative equity). This condition reduces both the financial incentive to stay current on payments and the ability of homeowners to sell a property in times of financial stress. As a result, those borrowers with negative equity are much more likely to default. Thus, securities backed by mortgages issued in more recent years have experienced higher delinquency and default rates than those issued in prior years.
The third factor is the loan-to-value (LTV) of the underlying mortgages. The LTV ratio divides the amount being borrowed against a property’s price at the time of purchase. It illustrates how much equity a buyer had in a property or how much leverage a buyer employed at the time of purchase. Unfortunately, the LTV ratio has a major shortcoming. While the LTV is adjusted for principal repayments, it neglects to take into account home price appreciation or depreciation after the date of purchase. Changes in LTV ratios can be inferred by broad changes in home prices, but the accuracy of any estimated LTV is subject to the multitude of factors that go into valuing a specific property. Given the substantial declines in residential real estate over recent years, the LTV ratios published in the remittance reports for most securitizations are too low.
The fourth factor to consider is whether the bond issue is backed by mortgages that fall into the adjustable rate (ARM) or affordability products classification. As home prices moved higher, buyers started stretching to purchase larger and more expensive homes. Affordability products, such as floating rate and interest only mortgages, became much more prevalent allowing a buyer to reduce the initial monthly payment. As many of these issue initial or “teaser” rates reset, the borrower could no longer afford the monthly payment. Consequently, these types of loans have experienced higher delinquency and default rates than fixed rate mortgages, all other factors being equal.
Other characteristics that can have an impact on a non-agency RMBS and should be considered are the geographic concentration and type of occupancy. The geographic concentration of the properties in the pool of mortgages will impact performance if there is a large concentration of states experiencing above average default and delinquency rates. The states experiencing the highest foreclosures are Nevada, Florida, Arizona, and California. There are also several types of occupancy including owner-occupied, investment, and vacation properties. Defaults in investment and vacation properties have been running at a higher rate than owner-occupied properties. Taking all of these characteristics into consideration will provide a more robust and reliable model.
Loan Performance:
The performance data utilized for cash flow modeling typically focuses on three key elements of the collateral in mortgage-backed securities: the future default rate assumptions, roll rates, and severity of losses.
Default rates in most cash flow models are based on the current delinquency and default experience for the type of loan (i.e. prime, Alt-A, subprime), the vintage year of origination, and the rate of change for delinquencies and defaults. The most commonly used method for projecting future losses is the constant default rate (CDR). Under this method, CDR is expressed as an annualized percentage of mortgages that default in a pool. A CDR of 10 means that 10% of the outstanding mortgages in a pool are expected to default over a 12 month period. Since 2007, CDRs for all three types of loans have increased to historically high levels.
Remittance data from the servicer for each non-agency RMBS will include the percentage of the pool at the various stages of delinquency. Not all borrowers that are delinquent will end up in foreclosure and default on a loan. Roll rates are defined as the percentage of delinquencies that are 60 days or more late that ultimately default on the loan. Securitizations with lower quality buyers and higher LTV ratios have typically experienced higher roll rates than those bonds backed by higher quality buyers and lower LTV ratios.
After a borrower defaults on a loan and the bank takes possession of the property, the bank will eventually sell the property to recover funds. The percentage of the loan’s remaining principal balance that is lost after the sale is defined as the severity. For example, assume a borrower defaults on a loan that has a $500,000 remaining balance. After the bank takes possession of the home, it is sold for $350,000. After legal fees and other costs are subtracted, the net recovery is $300,000. In this example, the severity of the loss is 40%. Severity ratios are usually included in the remittance data from the servicer.
Constructing Scenarios:
While arguments can be made for different methodologies to construct scenarios to analyze non-agency RMBS, it is our view that a model should focus on the three key elements of collateral performance mentioned above: future default rate assumptions (CDR), roll rates, and severity of losses. The challenge that insurance companies and investment professionals face is how to determine the appropriate levels for each of these factors. A good starting point for scenario testing begins with a review of the current delinquency and default rates for the loans backing the issue and the rate of change for delinquencies and defaults.
The exhibit below provides a recent snapshot of the performance statistics for the three primary sectors of the non-agency RMBS market, but the current remittance data for the individual issue being analyzed will provide more meaningful data. Additionally, historical trends should be incorporated into the modeling process.
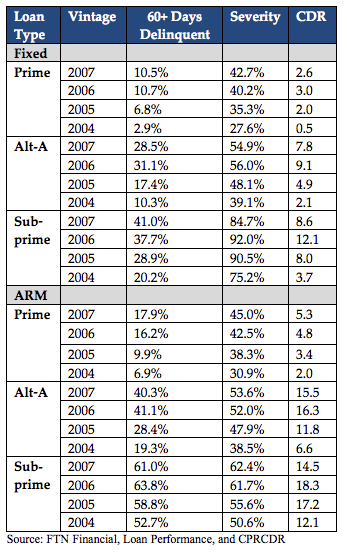
In addition to the current performance, a forward looking forecast based on the broad trends of the housing market and mortgages underlying the bond needs to be considered. While there are many differing views on the direction of the housing market, the current consensus economic view calls for minor improvements in the residential real estate market during 2010. Home prices would appear to be at or near a bottom based on the S&P/Case-Shiller Index, which has shown month-overmonth improvements in home prices since June of 2009. However, unemployment is expected to remain at elevated levels and home foreclosures are anticipated to continue mounting, which may put further pressure on the housing inventories and prices. Taking these factors into consideration, we believe that a conservative scenario would assume defaults will be higher than the current and past experience for some period of time before gradually declining.
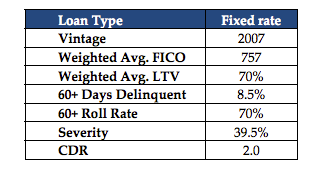
By incorporating the actual performance trends of the underlying collateral with a forecast based on the trends of the broader housing market, a framework can be developed for cash flow modeling. In our view, the model should reflect current experience of the mortgage pools using current roll rates, default rates, and severities to liquidate the seriously delinquent loans as a starting point for determining future CDR’s. These factors can be used to project a ramp of future default rates, beginning with a CDR that is higher than the current default rate and declines over a specified time horizon to a terminal rate. Over a longer period of time, the residential housing market should stabilize and ultimately prices will increase. The majority of homeowners who have remained current on their loans through this extremely difficult economic cycle will likely remain current in the future. As such, future CDR levels over time should regress towards historical levels. For example, assume the underlying mortgage loans for a bond deal have the following characteristics and performance, as of December 31, 2009:
Taking into consideration these characteristics and performance measures and acknowledging that over time performance will ultimately revert to its historical mean, we suggest the following scenario:
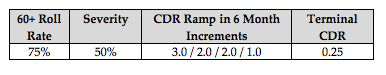
In the exhibit above, 75% of the loans that are delinquent by sixty days or more are immediately defaulted at a 50% severity. Then, the model projects sequential future defaults of 3 CDR for six months, 2 CDR for twelve months, 1 CDR for six months, and 0.25 CDR for the remaining life of the security (terminal CDR).
The output from the model will be a series of future cash flows beginning in the current period and ending when the security has entirely paid off. To calculate fair value, the next step is to determine an appropriate discount rate to apply to these cash flows. The discount rate can have a substantial impact on the net present value result. Therefore, it needs to be based on reasonable and supportable assumptions and commensurate with the risks of the security. We believe that a reasonable methodology would utilize a risk free rate plus an appropriate risk premium that reflects observable risk premiums for bonds with similar characteristics. The process for determining the discount rate should be documented and verifiable by an auditor. Once the discount rate is determined and applied to the cash flows, the result of the net present value calculation will represent the fair value of the security.
We believe this approach provides a reasonable framework for valuing non-agency RMBS in the event that quoted market prices are not orderly and/or there is no active market. Additionally, these methods can be used to bifurcate credit impairment losses in accordance with FASB’s amendment to ASC 320 Other than Temporary Impairment, originally issued as FSP 115-2 (FSP 115-2) and SSAP 43r. These types of analyses should be updated on a quarterly basis with changes in the performance reflected in the model assumptions.
An Auditor’s Perspective On Non-Agency RMBS Analysis by Johnson Lambert & Co. LLP
As auditors, we utilize a risk-based approach to examine a company’s financial statements. We use assertions to assess the risks associated with a particular financial statement line item. Investment assets are frequently assessed for the valuation assertion, whether the values carried by the entity are carried at appropriate amounts. The valuation assertion, as it relates to investments, has confounded auditors and their clients over the past two years as the continuing recession causes investment markets and regulatory bodies to react to newly presented fair value problems.
The amount of non-agency RMBS as a percentage of a company’s entire investment portfolio, the complexity of the investment, and the credit rating of the borrower helps determine the nature and extent of auditor testing of non-agency RMBS. An auditor will spend more time on a portfolio that includes a high percentage of complex RMBS compared to the total portfolio, especially if the credit rating or weighted-average quality of the underlying borrowers is low.
Recently, more so than any other, there is higher risk associated with management’s assertion regarding investment valuation. Estimates of future cash flows are involved, and determining the reasonableness of those estimates requires a great deal of auditor judgment.
Non-Agency RMBS Valuation:
The popularity of non-agency RMBS holdings within the insurance industry coupled with the FASB’s issuance of FSP 115-2 in April 2009 triggered the NAIC to revise Statement of Statutory Accounting Principles No. 43: Loan-backed and Structured Securities (SSAP 43r) during 2009. FSP 115-2 and SSAP 43r, help define the nature of an investment’s impairment and further present a basic framework in defining fair value for difficult to value securities including RMBS. The guidance places responsibility on management to be able to support assumptions in their cash flow model for investment valuation.
Due to the current economic climate, a considerable amount of non-agency RMBS are no longer actively trading, making valuation difficult under the “exit” pricing strategy required by accounting guidelines. To gain comfort over the investment amounts in a company’s financial statements, first, we look to the client to understand their methodology on investment valuation. The insurer’s investment manager, such as AAM, should be a valuable resource in this process. The investment manager can provide information regarding basic loan characteristics that could affect the value of a security and also discuss the major assumptions in its cash flow model. The investment manager can provide historical data on trends in default rates and loss severity, which can be used to support current cash flow assumptions and, ultimately, fair value. If the investment manager has a SAS 70 report on internal controls, useful information relating to the accuracy of calculations may be available for auditors to rely on, decreasing testing for the auditor, which invariably decreases cost for the client.
Assumptions Driving the Cash Flow Model:
To become comfortable with the value of non-agency RMBS on a company’s books, it is important to understand the assumptions involved in the cash flow analysis used to arrive at a fair value estimate. Auditors will be most interested in key assumptions in the cash flow model that create significant variability within the financial reporting process. As discussed by AAM in the preceding paragraphs, items such as default rates, roll rates, and severity of losses affect the estimated fair value of non-agency RMBS, and would be of particular interest to auditors in assessing these types of securities.
In order to determine whether or not the assumptions are appropriate, auditors must develop expectations regarding the cash flow assumptions. Trends in the underlying factors affecting inputs into the model, including credit rating, vintage, LTV, and adjustable rate products provide a sufficient place to begin creating these expectations. Additionally, auditors will consider general trends in the housing market and unemployment rates. If these factors are not seeing sizable improvements, it stands to reason that default rates on non-agency RMBS are likely to remain higher than usual in the foreseeable future. For example, if a company holds a non-agency RMBS with a mid-range credit rating, originating in 2008 as an adjustable rate product, we may not reasonably expect a full cost recovery based on current economic conditions, including recessed home values, and high unemployment rates.
In addition, expectations can be developed utilizing publicly available industry data. An auditor of an insurance company may be able to benchmark the company’s non-agency RMBS holdings against nonagency RMBS holdings of other insurance companies. If the company’s RMBS portfolio varies greatly from similar insurance company RMBS investments, valid questions may be raised regarding the reasonability of the assumptions driving the cash flow model. In addition to the cash flow modeling provided above, on January 25, 2010, the Securities Valuation (E) Task Force of the NAIC issued guidance (1) on RMBS valuation and determining designations for RMBS held by an insurer. The guidance includes specific instructions for valuing RMBS in relation to Risk Based Capital calculations that may be useful in evaluating cash flow modeling assumptions.
Importance of Documentation:
More often than not, there will be some assumptions that will not meet the auditors’ expectations, whether they are based on knowledge of the economy, industry averages, or some other benchmark. Client documentation of the RMBS valuation process is critical. There will be times when it makes sense for a company to deviate from industry averages, or special circumstances that require stepping away from the beaten path. These circumstances are not inherently wrong, but the auditor must be able to understand the reasoning behind the departure. If a company clearly documents their reasoning behind assumptions, deviations from the norm, and cash flow discount factor selection up front, headaches will be avoided down the road.
The key considerations outlined above should be the Company’s focus in preparation for an audit which includes the valuation of non-agency RMBS in active markets, non orderly transactions or concerns regarding credit loss impairment. The framework provides a basis for companies to identify what questions auditors may ask about these securities, so they can be prepared with thoughtful responses at year-end.
A Final Thought:
It has become evident over the past several years that a straightforward definition of fair value is difficult to achieve. As more of the financial reporting world moves toward International Financial Reporting Standards, it has become even more apparent that transparency may be the only constant achieved. Hopefully the analysis above has shown that companies must take a greater role in understanding their investment portfolio make-up and specific security characteristics; and in documenting this understanding, with the help of their asset manager. We are certain that as the markets continue to develop, and new and more creative investment vehicles are explored, the auditing industry and insurance regulators, as advocates for these public markets, will further demand more rationale and support from those charged with governance and asset managers.
Works Cited:
(1) – Task Force E, subgroup of the Financial Conditions (E) Committee of the National Association of Insurance Commissioners. Final Version of the Interim Reporting Instructions for the Year Ending December 31, 2009. For Use in Reporting Residential Mortgage Backed Securities. Can be accessed through: www.rmbs.naic.org.
Written by:
Kevin K. Adams
CFA Senior Portfolio Manager
AAM
Joshua W. Partlow, CPA
Principal
Johnson Lambert & Co. LLP
Erik T. Braun, CPA
Manager
Johnson Lambert & Co. LLP
Lauren Williams, CPA
Associate
Johnson Lambert & Co. LLP
About Johnson Lambert & Co. LLP:
Joshua W. Partlow, CPA, Erik T. Braun, CPA, and Lauren Williams, CPA are affiliated with Johnson Lambert & Co. LLP, a CPA firm formed in 1986. Johnson Lambert & Co. LLP’s business strategy, unique among CPA firms, is to focus aggressively on distinct industry niches where the firm can differentiate itself by possessing an unparalleled depth of technical expertise and experience specifically relevant to client needs. Insurance is one of only three industry niches on which the firm has elected to focus. Similarly the firm is selective in the nature of the services provided to selected industry niches, providing almost exclusively audit/assurance and business tax services. For contact and further information visit www.jlco.com
This publication/paper has been prepared by AAM and Johnson Lambert & Co. LLP. It is provided to you for informational purposes only. The information contained in this publication has been obtained from sources that AAM and Johnson Lambert & Co. LLP believe to be reliable, but AAM and Johnson Lambert & Co. LLP does not represent or warrant that it is accurate or complete. The views in this publication are those of AAM and Johnson Lambert & Co. LLP and are subject to change and AAM and Johnson Lambert & Co. LLP has no obligation to update its opinions or the information in this publication. Neither AAM or Johnson Lambert & Co. LLP, nor any of their respective officers, directors, members, or employees accepts any liability whatsoever for any direct or consequential loss arising from any use of this publication or its contents. The securities discussed in this publication may not be suitable for all investors. The value of and income from any investment may fluctuate from day to day as a result of changes in relevant economic markets (including changes in market liquidity). The information in this publication is not intended to predict actual results, which may differ substantially from those reflected. Past performance is not necessarily indicative of future results.
Disclaimer: Asset Allocation & Management Company, LLC (AAM) is an investment adviser registered with the Securities and Exchange Commission, specializing in fixed-income asset management services for insurance companies. Registration does not imply a certain level of skill or training. This information was developed using publicly available information, internally developed data and outside sources believed to be reliable. While all reasonable care has been taken to ensure that the facts stated and the opinions given are accurate, complete and reasonable, liability is expressly disclaimed by AAM and any affiliates (collectively known as “AAM”), and their representative officers and employees. This report has been prepared for informational purposes only and does not purport to represent a complete analysis of any security, company or industry discussed. Any opinions and/or recommendations expressed are subject to change without notice and should be considered only as part of a diversified portfolio. Any opinions and statements contained herein of financial market trends based on market conditions constitute our judgment. This material may contain projections or other forward-looking statements regarding future events, targets or expectations, and is only current as of the date indicated. There is no assurance that such events or targets will be achieved, and may be significantly different than that discussed here. The information presented, including any statements concerning financial market trends, is based on current market conditions, which will fluctuate and may be superseded by subsequent market events or for other reasons. Although the assumptions underlying the forward-looking statements that may be contained herein are believed to be reasonable they can be affected by inaccurate assumptions or by known or unknown risks and uncertainties. AAM assumes no duty to provide updates to any analysis contained herein. A complete list of investment recommendations made during the past year is available upon request. Past performance is not an indication of future returns. This information is distributed to recipients including AAM, any of which may have acted on the basis of the information, or may have an ownership interest in securities to which the information relates. It may also be distributed to clients of AAM, as well as to other recipients with whom no such client relationship exists. Providing this information does not, in and of itself, constitute a recommendation by AAM, nor does it imply that the purchase or sale of any security is suitable for the recipient. Investing in the bond market is subject to certain risks including market, interest-rate, issuer, credit, inflation, liquidity, valuation, volatility, prepayment and extension. No part of this material may be reproduced in any form, or referred to in any other publication, without express written permission.