insight
“The Future Ain’t What It Used to Be”: AAM 2016 Investment Outlook
January 11, 2016
[toc]
MACRO-ECONOMIC REVIEW AND OUTLOOK
U.S. Economic growth for 2016 is expected to improve modestly from 2015 as consensus forecasts are projecting real GDP to increase 2.6% compared to the 2.1% increase for 2015 (Exhibit 1). The improvement in economic activity is predicated on better prospects for private and business investment, stronger residential investment, and a more favorable trade balance. Consumer spending, which accounts for approximately 70% of economic activity, is projected to remain relatively stable versus 2015. The improvement in the labor market last year and the recent rise in wages are positives for the growth outlook. We believe that these positive factors are outweighed by the downside risks to growth which include a strong U.S. dollar, weak global growth, and an increase in geopolitical risks. While we are not expecting a recession, we believe growth will be at the 2% or below level in the year ahead.
Exhibit 1: Real U.S. GDP Growth
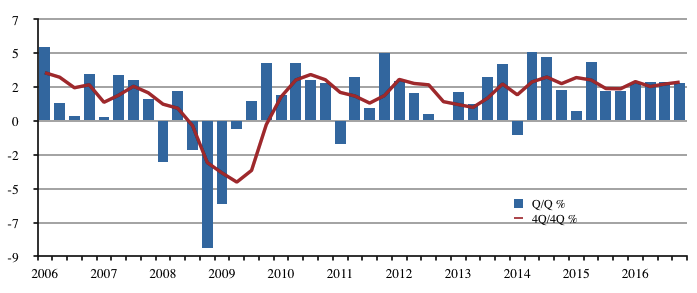
Source: Bloomberg, Bureau of Economic Analysis
On the inflation front, consensus projects consumer prices to increase. For 2016, the Consumer Price Index (CPI) and the Core Personal Consumption Expenditure index (PCE) are projected to increase 1.8% and 1.6%, respectively. We believe low commodity prices, a strong U.S. dollar, and weak global growth will keep downward pressure on inflation throughout 2016. Although we’ve seen a modest rise in wages, we don’t believe wage pressures are strong enough to offset the downward pressures on inflation. However, continued improvement in the labor market is a risk to our inflation outlook.
The Federal Reserve, as expected, raised rates at its December meeting after seven years of maintaining the Fed Funds rate near zero. The initiating of a rate tightening cycle tells us that the Fed believes there has been sufficient improvement in labor market conditions and enough evidence exists that inflation will move higher in the near-term to warrant an increase in rates. We now expect the Fed to take a wait and see approach for future rate increases. “Gradual” and “data-dependent” were key words in the Fed’s December statement as the Fed’s own “dot plot” projects four rate increases for 2016. Given our benign inflation outlook, we believe the actual number of rate increases this year will be less than what the Fed is currently projecting and more likely to be in the order of two or three increases instead of four.
Weak global growth will likely keep monetary policies between the Fed and other central banks on a diverging path. With central banks outside the U.S. intent on keeping rates low, U.S. government yields will continue to look attractive relative to other government bonds. Exhibit 2 shows the yield advantage of 10-year U.S. Government bonds versus 10-year bonds of select developed countries.
Exhibit 2: 10 Year U.S. Treasury Yield Advantage
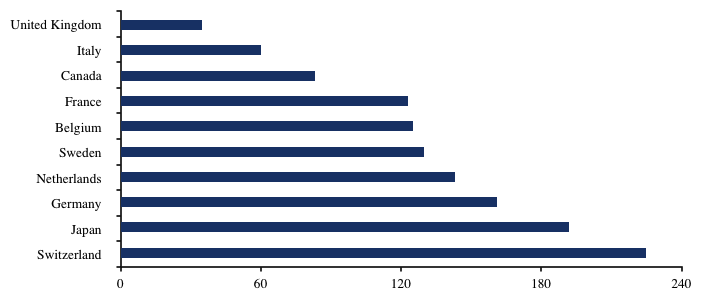
Source: Bloomberg, Spreads as of 01/07/2016
Consensus forecasts are calling for a modest increase in Treasury yields over the course of 2016. The yield on the benchmark 10-year Treasury note is expected to increase about 60 basis points and end the year at 2.90% based on the median estimate of economists polled by Bloomberg. With the Fed expected to raise rates, the yield curve should continue to flatten. We are expecting the yield on the 10-year Treasury note to end the year below consensus estimates. The lower-than-consensus estimate is due to the expectation of weaker than expected economic growth in the U.S. and abroad, low inflation expectations and lower foreign government yields attracting capital to the U.S. We project the 10-year Treasury yield will end the year between 2.50% and 2.75%.
CORE FIXED INCOME OUTLOOK SUMMARY
2015 was a tumultuous year. The broad fixed income market returned 0.55%, the S&P 500 returned 1.37%, and High Yield returned -4.47%, with the bright spot being Tax-exempt Municipals returning 3.30%. Investment grade Energy and Mining credits suffered badly, underperforming Treasuries by 9.80% and 15.55% respectively.
We expect stable albeit slow growth in the U.S. economy, and a volatile investment environment in the first half of 2016 which should impact returns across risk sectors including both High Yield and Equities. We have increased our allocations to high quality assets such as Asset Backed Securities (ABS) and Treasuries over the last 18 months; therefore, we are prepared to take advantage of wider spreads in both Corporates and Mortgage Backed Securities (MBS).
Outlook
The U.S. economy continues to grow at a steady pace, the unemployment picture continues to improve, and there is little inflationary pressure on the horizon. Historically, this type of environment would cause us to feel pretty good about the prospects for our markets. However, in the words of Yogi Berra, “the future ain’t what it used to be.” Our economic future seems much more tied to what happens with China, the world’s second largest economy. Although GDP has officially grown at 6-7% over the last two years, we view both the housing and the industrial sectors as overbuilt and believe GDP growth has been overstated by authorities for some time. The lower rate of growth and transition to a service led economy translated into slower than expected purchases of commodities. Since global capacity has been built around 7-10% annual Chinese growth, supply far exceeds demand and commodity prices have fallen significantly as a result.
The collapse in prices in the Metals and Mining and Energy sectors has inflicted stress in these areas, with bond prices of BB and BBB rated companies falling 60% and 20%, respectively. These steep discounts have allowed some high yield companies the opportunity to pursue distressed debt exchanges, trading existing debt for newly created debt with better recovery prospects in the event of a future bankruptcy. This “distressed debt exchange” was traditionally used by companies in dire financial circumstances as a way to postpone a pending bankruptcy and effectively, restructure out of court. In today’s environment, we have seen this used to reduce debt by relatively stronger high yield companies with reasonable liquidity positions. The fact that this type of transaction is now a possibility has caused significant price deterioration in bonds of high yield and investment grade Energy and Materials companies with debt trading at distressed levels but that are not facing imminent bankruptcy. While we are not expecting investment grade management teams to pursue distressed debt exchanges, it could be a source of underperformance in 2016.
The Corporate bond market underperformed Treasury securities in 2015 by 1.61%, but after excluding the Energy and Metals and Mining sectors, the return approximates Treasuries with Financials outperforming. We expect default and rating risk will increase as financing conditions and credit fundamentals deteriorate, widening Corporate bond spreads during the first half of the year and providing a buying opportunity, possibly later in the year as the cycle begins to turn.
We view the continued purchases by the Fed of MBS securities as artificially supporting prices. Therefore, we are underweight MBS due to valuation concerns despite the sector being viewed as a “safe haven sector” in a period of expected volatility. In lieu of MBS, we favor the highest quality ABS and Treasuries. Although our portfolios tend to overweight investment grade Corporate bonds, we have taken steps to upgrade the quality and reduce our overall allocation over the last 18 months. We expect to begin to add once our fundamental outlook improves and valuations become more compelling.
Away from the taxable market, tax-exempt municipals provided stellar relative returns during 2015, and because of this significant outperformance, we have been reducing our positions in favor of other more attractive sectors.
In summary, we expect continued volatility in the markets over the near term and have prepared the portfolios to take advantage of wider spreads in both Corporates and MBS.
CORPORATE CREDIT
A strong dollar and low commodity prices resulted in weaker financial performance, rating downgrades, and wider spreads for the Energy and Basic Materials sectors in 2015. This coupled with debt financed merger and acquisition activity resulted in the investment grade corporate bond sector generating negative returns versus Treasuries. As investors fled these sectors, they sought protection in sectors such as banks, REITs, and waste management companies, with only eight of 48 sectors generating positive excess returns versus Treasuries. Looking ahead to 2016, we believe similar drivers will dictate returns for the first half of the year. With a higher level of spread volatility and rating downgrades, we expect lackluster performance for the investment grade corporate sector in 2016. We remain comfortable investing cautiously in the sector because of the health of the banking sector, strength of the domestic consumer, and improving labor market. Further, corporate bonds are offering higher yields versus this time last year. However, we remain diligent with our credit analysis and recommend a more defensively positioned portfolio.
Starting with commodities sectors, we expect the price of oil to bottom as storage capacity is fully utilized, resulting in a material cutback in production. The futures curve suggests that prices should recover slightly in the second half of the year as concerns ease regarding supply and fully utilized storage capacity. Our outlook for base metals is less certain, as we still need to see greater wholesale production cuts to rebalance the supply side. With real Chinese growth estimated at far less than the reported 6-7%, it is difficult to project a sustained improvement in prices given the fact that China demand accounts for between 40% and 60% of global base metal supply. We expect prices to remain low in 2016. Therefore, we are prepared for continued ratings downgrades for commodity producers in the first half of the year. Spreads reflect this dismal outlook, but could remain under pressure as investors capitulate and/or sell, as ratings fall to below investment grade. Importantly, we are comfortable with the near term liquidity profiles of investment grade companies and do not expect them to pursue distressed debt exchanges. We are opportunistically investing in the Energy sector.
Away from commodities, we expect the high level of merger and acquisition (M&A) activity to persist until the cost of debt and equity compresses. In the meantime, companies are incentivized to merge in order to cut costs and protect margins until global growth accelerates. Sectors more vulnerable to this activity include: Chemicals, Food and Beverage, Media, Technology, Consumer Products, Diversified Manufacturing, Pharmaceuticals, European Telecom and potentially Railroads. We continue to believe credit selection is paramount in these sectors.
After four consecutive years of outperformance, we are growing more cautious on the bank sector due to both fundamental and valuation concerns. Fundamentally, bank balance sheets remain very strong, reflecting high levels of capital and liquidity. However, we are concerned that the turmoil in energy and high yield will increasingly bleed into operating results via higher credit costs. These asset quality concerns come against the back-drop of still challenged bank profitability due to depressed interest rates. Although a rate hike cycle should ultimately aid net interest income generated by the banks, such positive operating momentum is unlikely until we experience multiple Fed rate hikes.
As financing conditions deteriorate (Exhibit 3), the risk of credit spreads repricing wider in 2016 increases. The high yield market is under stress with CCC rated credit spreads at recession type levels, banks tightened lending standards in the third quarter – a leading indicator for investment grade spread widening, and the non-bank credit market showing signs of contraction with “accounts for collection” falling into contraction territory. Given this and the fact that credit fundamentals are the weakest they have been from a balance sheet perspective since the early 2000s, we are cautious on the market and recommend investing in defensive sectors such as: Electric Utilities, Aerospace/Defense, Environmental Services, and Pharmaceuticals. We are also comfortable with high quality retailers. We expect credit selection to become increasingly important in the REIT sector, as we expect operating results of individual REITs to diverge. We also anticipate the ability of insurance companies to withstand higher credit defaults and rating downgrades in their investment portfolios will be tested next year, preferring the more conservative issuers.
Exhibit 3: Financial Conditions Index
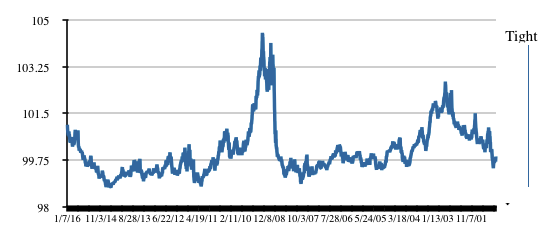
Source: Goldman Sachs
For 2016, corporate bond supply should be flat versus 2015 on a gross and net basis. We expect gross supply at approximately $1.15 trillion, while net supply should be around $540 billion, both high from a historical perspective. Key factors will be M&A related supply from the non-financial sector and whether companies decide to pre-fund maturities due 2017 and 2018. Offsetting supply figures in the non-financial arena will be a decline in financial sector supply primarily due to less stringent language in the Fed’s recent TLAC (Total Loss Absorbing Capital) announcement. Demand is expected to remain supported by foreign investors and rate sensitive buyers such as insurance companies and pension managers, assuming credit defaults remain low and domestic interest rates remain relatively attractive. We expect long end demand to increase if yields breach the 5.25% threshold. Changes in regulation have affected broker dealer inventory levels and the repo market; therefore, we expect liquidity to remain challenging, widening bid/offer spreads and liquidity premiums.
STRUCTURED PRODUCTS
For the third year in a row, Structured Product securities generated unimpressive returns as global volatility and liquidity worries weighed on spread sector returns. Both agency mortgage backed securities and senior commercial mortgage backed securities underperformed similar duration Treasuries during 2015. Much as we discussed at this time last year, Federal Reserve policies relating to the ongoing purchase of agency mortgage backed securities and the timing of future interest rate hikes, present significant challenges to sector returns in the coming year. We anticipate that 2016 will look much like 2015 and that most subsectors within Structured Products will struggle to outperform Treasuries.
Residential Mortgage Backed Securities (RMBS):
Compressed yield spreads resulting from the ongoing Fed QE3 purchase program and adverse prepayment experience caused agency RMBS to underperform Treasuries in 2015 as they did in 2014. As we look to 2016, we continue to see a very challenging environment for the sector. Not only do spread levels remain at uneconomical levels, but now that the Fed has begun to raise interest rates, investors will need to address the impending reduction and eventual end of the massive Fed purchases that have distorted the market for the past five years. The consensus is that the Fed will continue to purchase securities to maintain its $1.7 trillion portfolio until at least mid-year at which time they’ll begin to reduce purchases, withdrawing entirely from the market by the end of 2016 or early 2017.
We anticipate that yield spreads could widen 35 to 45 basis points (bps) as we approach the conclusion of the program. We’re basing our assessment on valuations for current coupon mortgage securities in 2010 and 2011 when the Fed was not an active participant in the market. This corresponds to the time period between the conclusion of QE2 in July of 2010 and the beginning of QE3 in June of 2011. During that time period, newly issued mortgage backed securities traded at an average yield spread of 120 bps to Treasuries. As demonstrated in Exhibit 4, that is quite a bit wider than the trading levels during this past year.
Exhibit 4: Current Coupon Mortgage Spread
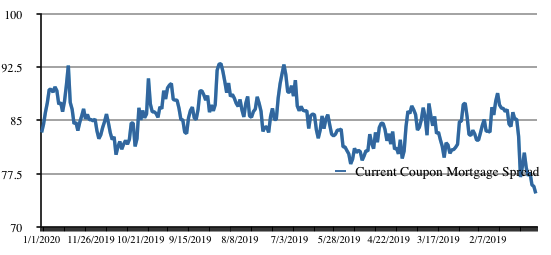
Source: Bloomberg
We continue to maintain mortgage weightings that are substantially below our customary levels as well as below relevant benchmark weightings. With stretched valuations and the impending exit of the dominant purchaser of mortgage securities about to exit the market, we see little value in the sector at this time.
Commercial Mortgage Backed Securities (CMBS):
Despite steadily improving real estate fundamentals, CMBS underperformed Treasuries in 2015. Broader market volatility and liquidity concerns surrounding impending regulatory changes put significant pressure on yield spreads throughout the year. Despite spreads having widened by roughly 40 bps, we believe the prospects for CMBS in 2016 are not much better than those of Treasuries. However, a marked decline in global market volatility could lead CMBS to marginally outperform Treasuries.
Real Estate prices continue to surge across the nation and have surpassed the peak valuations seen in 2006. As we pointed out last year, there continues to be a significant difference between the pricing in urban, primary markets and smaller, secondary markets. Exhibit 5 reflects the significant appreciation of major market real estate assets since the recession.
Exhibit 5: Moody’s/Real Commercial Property Prices Indices
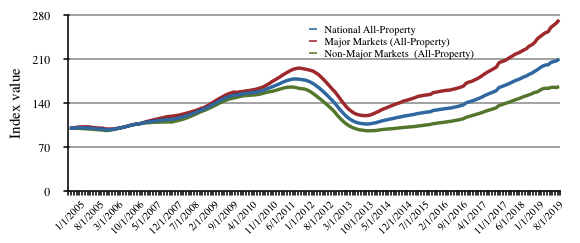
Source: Moody’s
Higher property values have bolstered CMBS credit metrics by allowing many of the properties financed at the top of the market from 2005 to 2007 to refinance, driving down delinquency rates. The problem we have with the market is that many of these marginal properties, many in less desirable markets, are refinancing into current conduit transactions. There are some 23 different originators of conduit, commercial real estate loans and the intense competition between them is leading to many of the poor underwriting habits leading up to the 2008 crash. Shoddy underwriting when combined with overall aversion to risk assets during bouts of market turmoil from global events makes us very cautious with our approach to CMBS in 2016.
Asset Backed Securities (ABS):
MUNICIPALS
The tax-exempt market experienced quite a bit of volatility during the first six months of 2015, as the sector weathered a record pace of refinancing related issuance. Supply during the March through June months averaged $41 billion per month, with refinancing related deals comprising 35% of total supply. The weak technicals during this period resulted in 15-20 year maturity tax-adjusted yield spread widening by an average of 51 bps between January 15 and May 22. However, during the second half of the year, Municipals exhibited an impressive rally. The stronger performance was driven in large part by strong demand flows and new issue supply levels that were well-below expectations over the last four months of the year. Consequently, since Sept. 15, average 15-20 year maturity tax-adjusted spread levels contracted by a massive 68 bps into year-end.
We find a number of parallels to 2015 that should play a large role in shaping performance this year. Starting with the new issue cycle, we believe that many of the attractive refinancing opportunities that the sector experienced during the first half of 2015 are still available today. As we start the year, lower absolute yields and a flatter yield curve from 2 to 30 years provide issuers with an opportunity to significantly reduce their debt service cost. State and local governments are likely to take advantage of these savings before they potentially evaporate as the Fed moves toward normalizing interest rates. During the second half of the year, if rates move higher, we should see issuance levels slow. Overall estimates for supply in 2016 are expected to be $375 billion or 5% lower than 2015.
Demand should also exhibit a similar pattern to 2015. Although the market had some difficulty in absorbing the heavy new issue cycle early in the year, relative valuations for the sector versus taxable alternatives didn’t exhibit the substantial levels of dislocations that we’ve seen in prior years. A primary catalyst for the strength in demand flows was a combination of heavy reinvestment flows of call proceeds into the market from the record level of refinancings, improving underlying credit fundamentals, and the absence of headline risk. Mutual fund flows, one proxy for denoting retail interest in the market, typically turns skittish around the prospects of a higher interest rate environment. However, after the Fed decided to keep rates unchanged in mid-September, weekly fund inflows have been exceptionally strong since that time, with a total of $6.8 billion. After the Fed finally raised rates in December, fund flows picked up momentum and closed the year with a 4-week average of $788 million per week.
Looking forward, we believe that heavy refinancing related issuance during the first half of the year will continue to provide strong reinvestment flows. Additionally, as the overall economy continues to provide slow, but steady growth, state and local governments should also see steady revenue growth to build on the 15 consecutive quarters of growth that they’ve already experienced. However, one area that could provide some volatility in demand flows is in headline risk tied to any tax reform that compromises the full tax-exemption status of the sector for investors in the highest tax brackets. Until the market gains more clarity as we approach the November 2016 elections (and the candidates’ tax reform proposals), we’re not likely to see any dramatic moves in the market tied to these risks until later in the year.
Another area of concern for the market in the near term is in the very expensive relative valuations of the sector to taxable alternatives. As of January 7, 2016, tax-adjusted spreads in 10-year municipals were 41 bps, tied for the tightest spread over the past 10 years (Exhibit 6). We believe that given the current level of rates and the expectation that refinancing and overall issuance levels will accelerate during the next six months, the current spread level is unsustainable and should normalize toward historical levels as the market moves through the heaviest issuance cycle of the year from March to June. Consequently, we’ve moved to a negative bias for the sector from a valuation perspective and are transitioning to an underweight position. Once relative valuations move back to more attractive levels, we will look at opportunities for entry points into the market to take advantage of better market technicals and stronger relative valuations during the second half of the year.
Exhibit 6: 10-Year Municipal Spread
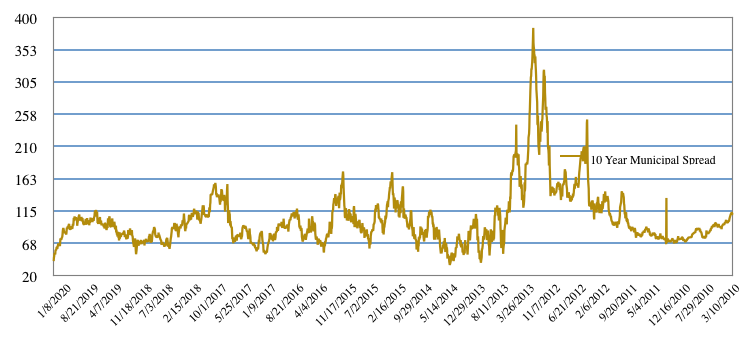
Ten year tax equivalent municipal yields reflect the Prime Municipal Yield Curve adjusted to a pre-tax equivalent using a tax adjustment factor of 1.4577. Source: Bloomberg, Thomson Municipal Market Data as of 1/7/16
HIGH YIELD
2015 was a particularly challenging year for the U.S. High Yield market as the commodity based sectors that were the most under pressure during the year make up almost 20% of the market. The broad market finished the year down -4.6% which was the sixth time in the last 30 years the High Yield market produced a negative return for the calendar year.
There was tremendous dispersion among sectors and credits as the market began to distinguish between the “haves” and “have-nots.” Generally speaking, the “haves” are higher quality credits from stable cash flow industries that have on-going access to capital markets. In contrast, the “have-nots” are lower rated, less liquid companies in more volatile sectors that have difficulty raising capital in today’s market. For example, the BB rated High Yield index was down -1% in 2015 with an average price of around $97 at year end, while the CCC subcomponent was down -15% with an average price well into distressed territory at $67. As you can see in Exhibit 7, the Energy and Metals & Mining subsectors fared even worse. This highlights the importance of the higher quality bias we feel is most appropriate for insurance investors.
Exhibit 7: U.S. High Yield Market Data
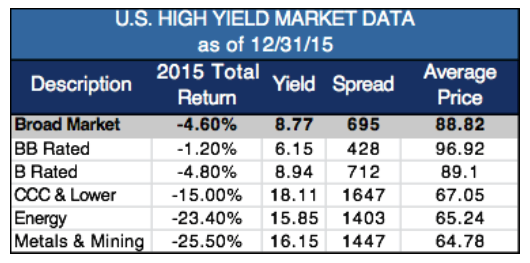
Source: Bank of America Merrill Lynch and Barclays Capital Indices Yield-to-Worst. Broad Market High Yield
– Bank of America Merrill Lynch US High Yield Cash Pay Index (H0A0), BB/B High Yield – Bank of America
Merrill Lynch U.S. BB-B Index (JUC4)
Despite this bifurcation (Exhibits 8 and 9), heightened volatility has pushed valuations for the overall sector to the most attractive levels since 2011. As of year end, broad market yields approached 9% with credit spreads near +700 bps which suggests a market implied default rate of 7%. This compares with the 2.3% default rate in 2015, and is double the 3.5% expected from our partners at Muzinich & Co. in 2016. The anticipated uptick in defaults is largely related to the Energy and Metals & Mining names. A higher quality focus on BB/B names with yields near 7.50% is compelling if one is willing to take a longer-term view in light of potential headwinds.
Exhibit 8: BB/B Yield Differential vs. Broad Market High Yield
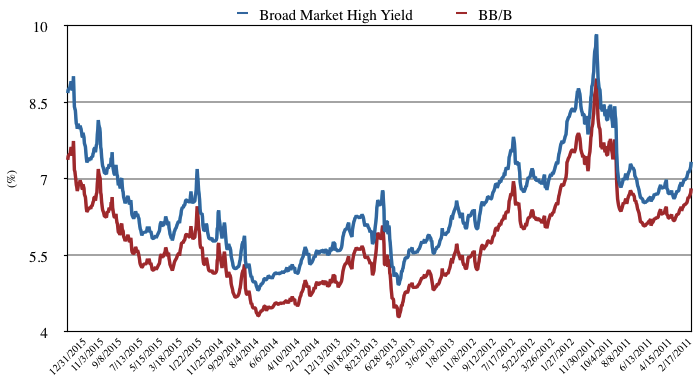
Source: Bank of America Merrill Lynch and Barclays Capital Indices Yield-to-Worst. Broad Market High Yield – Bank of America Merrill Lynch US High Yield Cash Pay Index (H0A0), BB/B High Yield – Bank of America Merrill Lynch US BB-B Index (JUC4)
Exhibit 9: BB/B Option Adjusted Spread Differential vs. Broad Market High Yield
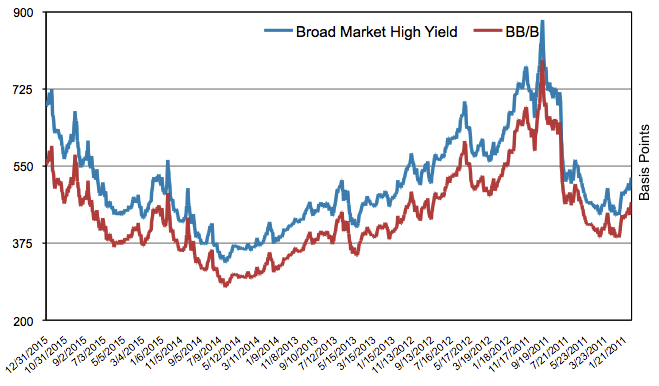
Source: Bank of America Merrill Lynch and Barclays Capital Indices. Broad Market High Yield – Bank of American Merrill Lynch US High Yield Cash Pay Index (H0A0), BB/B High Yield – Bank of American Merrill Lynch US BB-B Index (JUC4)
Corporate fundamentals for the majority of U.S. High Yield companies remain healthy. Many have refinanced their debt by extending maturities and have continued to maintain relatively high cash balances. The danger lies principally in highly levered basic materials companies that will face difficult refinancing conditions at current commodity prices. This environment favors active managers who emphasize credit quality, diversification, and liquidity to help reduce idiosyncratic risk in portfolios. Decreased liquidity in the markets is also likely to continue to contribute to price swings. Nevertheless, we expect credit underwriting to continue to be the most important component of returns throughout the cycle, and current valuations represent an attractive time for investors with a focus on fundamentals to be invested in the asset class. While there is likely to be continued volatility, long-term investors with stable capital should be well positioned to view near term weakness as a buying opportunity.
CONVERTIBLE SECURITIES
Commodity sector weakness, credit spread widening, and increased merger and acquisition activity were key drivers of performance within the U.S. Convertible market during 2015. In aggregate, the convertible sector return of -3.24% lagged the S&P 500 and Investment Grade Corporate bond market, but outperformed small cap equities and high yield debt. Importantly, when measured in comparison with underlying equities, convertible securities generally performed in line with expectations. Commodity sensitive issuers were most challenged due to the confluence of falling equity prices and widening credit spreads. However, with energy and materials issuers totaling less than 7% of the domestic convertible market, their effect was limited on overall returns. The degree to which performance varied by sector and market capitalization is evident in Exhibits 10 and 11.
Exhibit 10: 2015 Convertible Performance by Sector
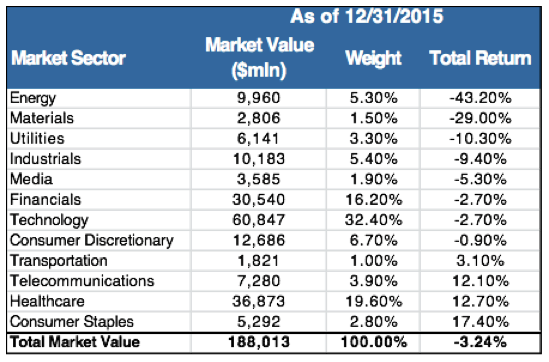
Source: Bank of America Merrill Lynch Global Research
Exhibit 11: Convertible Performance by Capitalization
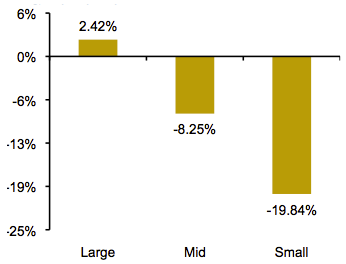
Source: Bank of America Merrill Lynch Global Research
Heightened volatility in equity and credit markets last year contributed to new issuance falling short of expectations and a year-over-year supply decline of 12%. Redemption activity, which totaled approximately $41 billion, fully offset new supply in the U.S. convertible market of $39 billion. Mandatory structures grew in popularity as a number of sizeable capital raises occurred in 2015, with proceeds utilized to bolster liquidity and finance acquisitions. We expect that stubbornly low commodity prices and continued merger and acquisition activity will lead to a healthy new issue calendar in 2016 as issuers in need of capital find value in the reduced financing costs and less equity dilutive nature of convertibles. Should that occur, declining redemptions should naturally lead to organic growth in the convertible market, a positive development for investors in the sector.
The bifurcation in convertible market valuations remains pronounced with small/mid capitalization and sub-investment grade rated issuers suggesting far more attractive risk/reward profiles than their large cap and investment grade rated counterparts. This dichotomy is consistent with our view that tighter lending standards, weakening fundamentals, and a rising default rate increase the risk of wider spreads in the year ahead. Event risk, which we view as elevated for certain investment grade bond sectors, and the expectation that companies will continue to repurchase their shares have the potential to benefit convertible security returns as prospective positive equity performance will offset negative credit implications.
Our market outlook suggests that equity and fixed income investors should prepare for sporadic volatility and limited total returns in the year ahead, not dissimilar from the market’s return profile in 2015. From a broad equity perspective, corporate earnings face continued pressure stemming from a strong U.S. dollar, and valuation multiples are unlikely to expand. The sector’s coupon carry and investment value serve to limit potential losses should equity values decline while preserving upside potential should equity markets move higher.
Macro-Economic Review and Outlook Commentary Written by:
Marco Bravo, CFA
Senior Portfolio Manager
Core Fixed Income Outlook Commentary Written by:
Reed Nuttall, CFA
Chief Investment Officer
Corporate Credit Commentary Written by:
Elizabeth Henderson, CFA
Director of Corporate Credit
Michael Ashley
Senior Analyst, Corporate Credit
N. Sebastian Bacchus, CFA
Senior Analyst, Corporate Credit
Bob Bennett, CFA
Senior Strategist and Trader, Corporate Credit
Patrick McGeever
Senior Analyst, Corporate Credit
Hugh McCaffrey, CFA
Senior Analyst, Corporate Credit
Structured Products Commentary Written by:
Scott Edwards, CFA, CPA
Director of Structured Products
Municipals Commentary Written by:
Greg Bell, CFA, CPA
Director of Municipal Bonds
High Yield Commentary Written by:
Scott Skowronski, CFA
Senior Portfolio Manager
Convertible Commentary Written by:
Tim Senechalle, CFA
Senior Portfolio Manager
For more information, contact:
Colin Dowdall, CFA, Director of Marketing and Business Development
colin.dowdall@aamcompany.com
John Olvany, Vice President of Business Development
john.olvany@aamcompany.com
Neelm Hameer, Vice President of Business Development
neelm.hameer@aamcompany.com
30 North LaSalle Street
Suite 3500
Chicago, IL 60602
312.263.2900
Disclaimer: Asset Allocation & Management Company, LLC (AAM) is an investment adviser registered with the Securities and Exchange Commission, specializing in fixed-income asset management services for insurance companies. This information was developed using publicly available information, internally developed data and outside sources believed to be reliable. While all reasonable care has been taken to ensure that the facts stated and the opinions given are accurate, complete and reasonable, liability is expressly disclaimed by AAM and any affiliates (collectively known as “AAM”), and their representative officers and employees. This report has been prepared for informational purposes only and does not purport to represent a complete analysis of any security, company or industry discussed. Any opinions and/or recommendations expressed are subject to change without notice and should be considered only as part of a diversified portfolio. A complete list of investment recommendations made during the past year is available upon request. Past performance is not an indication of future returns.
This information is distributed to recipients including AAM, any of which may have acted on the basis of the information, or may have an ownership interest in securities to which the information relates. It may also be distributed to clients of AAM, as well as to other recipients with whom no such client relationship exists. Providing this information does not, in and of itself, constitute a recommendation by AAM, nor does it imply that the purchase or sale of any security is suitable for the recipient. Investing in the bond market is subject to certain risks including market, interest-rate, issuer, credit, inflation, liquidity, valuation, volatility, prepayment and extension. No part of this material may be reproduced in any form, or referred to in any other publication, without express written permission.
Disclaimer: Asset Allocation & Management Company, LLC (AAM) is an investment adviser registered with the Securities and Exchange Commission, specializing in fixed-income asset management services for insurance companies. Registration does not imply a certain level of skill or training. This information was developed using publicly available information, internally developed data and outside sources believed to be reliable. While all reasonable care has been taken to ensure that the facts stated and the opinions given are accurate, complete and reasonable, liability is expressly disclaimed by AAM and any affiliates (collectively known as “AAM”), and their representative officers and employees. This report has been prepared for informational purposes only and does not purport to represent a complete analysis of any security, company or industry discussed. Any opinions and/or recommendations expressed are subject to change without notice and should be considered only as part of a diversified portfolio. Any opinions and statements contained herein of financial market trends based on market conditions constitute our judgment. This material may contain projections or other forward-looking statements regarding future events, targets or expectations, and is only current as of the date indicated. There is no assurance that such events or targets will be achieved, and may be significantly different than that discussed here. The information presented, including any statements concerning financial market trends, is based on current market conditions, which will fluctuate and may be superseded by subsequent market events or for other reasons. Although the assumptions underlying the forward-looking statements that may be contained herein are believed to be reasonable they can be affected by inaccurate assumptions or by known or unknown risks and uncertainties. AAM assumes no duty to provide updates to any analysis contained herein. A complete list of investment recommendations made during the past year is available upon request. Past performance is not an indication of future returns. This information is distributed to recipients including AAM, any of which may have acted on the basis of the information, or may have an ownership interest in securities to which the information relates. It may also be distributed to clients of AAM, as well as to other recipients with whom no such client relationship exists. Providing this information does not, in and of itself, constitute a recommendation by AAM, nor does it imply that the purchase or sale of any security is suitable for the recipient. Investing in the bond market is subject to certain risks including market, interest-rate, issuer, credit, inflation, liquidity, valuation, volatility, prepayment and extension. No part of this material may be reproduced in any form, or referred to in any other publication, without express written permission.