insight
Property & Casualty and Life Investment Review: Stable Allocations in a Shifting Landscape
May 17, 2021
Download PDF2020 was a lively year for investors, and insurers were no exception. It saw dramatic down-and-up volatility in equity markets and other risk assets, the return of ultra-low rates (including lows never before seen at the long end of the yield curve), and a head-spinning round trip in credit spreads. In this paper we summarize data we’ve collected on investment holdings and returns for the P&C and Life insurance industries including both 2020 and the prior 4 years. To add additional perspective we’ve broken each industry out into companies with total invested assets <$100 million, companies with assets from $100M – $1 billion, and companies >$1 billion, since company size is a significant factor driving how insurers invest. We’ve included only companies with at least 3 years of operating history as of 12/31/20, as startup insurers may have temporarily conservative investment allocations that aren’t representative of their longer-term investment targets. We summarize key observations and conclusions below, and follow with graphs detailing the data we reviewed.
P&C Industry
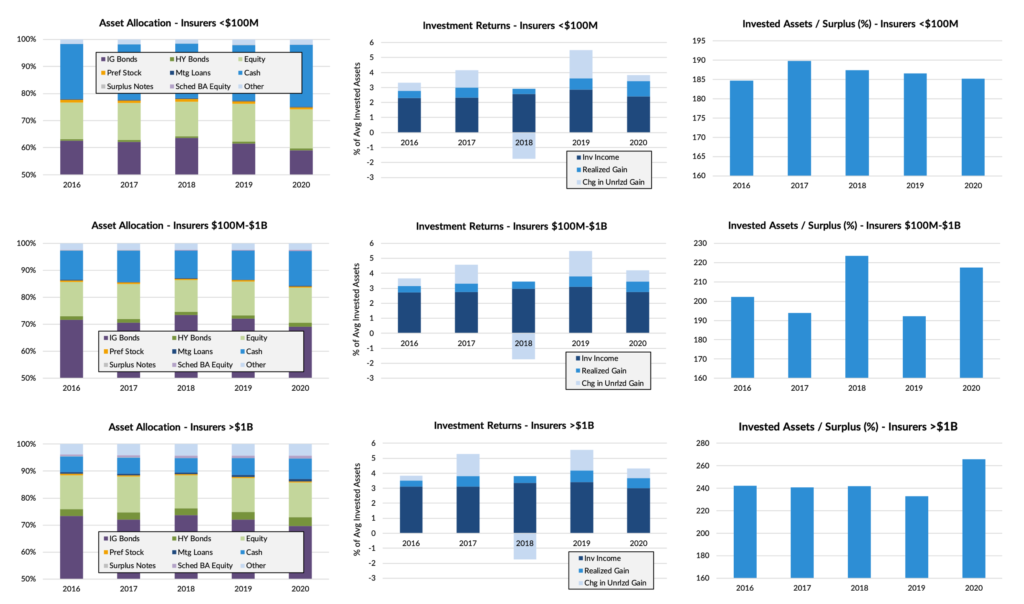
A few generalizations can be made about P&C insurance investors based on the data we observed:
- P&C insurers invest primarily in IG bonds and equity, with small allocations to other assets. The larger P&C insurers get, the less cash and equity they tend to hold, and the more other assets (IG bonds, HY bonds, mortgage loans, Schedule BA assets) they allocate to. For reference, the asset marked as “Other” on the graphs primarily consists of Real Estate, much of which is not held for investment purposes.
- Across all P&C insurers, IG bond holdings have modestly decreased in the past several years, with the largest share of the balance going into cash (especially in 2020). To the extent there’s been an increase in risky assets since 2016, it is very modest.
- Larger insurers tend to have higher balance sheet leverage than smaller ones. Average leverage has fluctuated from year to year but without a clear trend.
- Most Schedule BA assets held by P&C insurers are classed as having equity characteristics, likely constituting a mix of private equity, venture capital, and hedge fund holdings. Relatively few insurers with <$1 billion in assets allocate to Schedule BA assets, in part due to the complexity and high minimum investment sizes of these assets.
- After enjoying a rise in investment income in 2018 and 2019 as rates gradually rose, insurers saw their portfolio yields drop notably in 2020 as the yield curve plummeted. Prospects for near-term improvement on this front appear dim.
- Year-to-year trends in realized gains and mark-to-market surplus gains are primarily driven by annual equity market performance, which has been positive in all recent years except 2018.
Life Industry
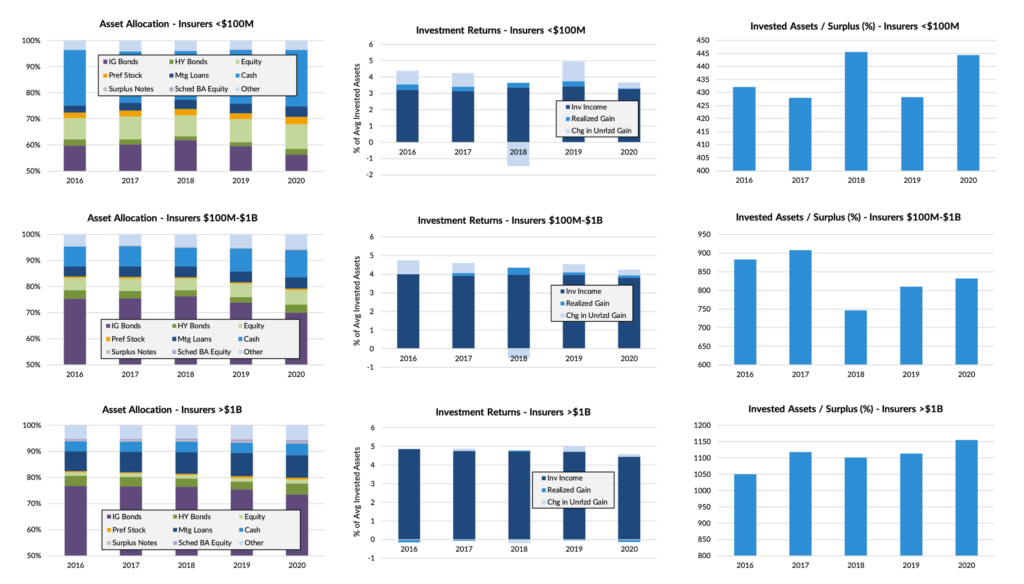
Life companies have significant differences in how they invest based on the data we observed:
- Life companies also hold core allocations to IG bonds, with additional holdings in cash, equity, HY bonds, and mortgage loans. Once again, Schedule BA holdings are mostly concentrated among the largest insurers.
- As with P&C companies, larger Life insurers tend to hold significantly less cash and a broader mix of assets. For the largest insurers, mortgage loans represent the 2nd largest category of holdings, whereas equity holds this position for small- and medium-sized companies. Smaller companies also tend to hold more preferred stock than larger ones, perhaps due to the small size of the sector and the challenges larger insurers face in building diversified allocations.
- As with P&C companies, allocations to IG bonds have declined since 2016, though significant variability exists among which other sectors have benefited. For small and medium companies cash received the largest share (especially in 2020), but for the largest insurers mortgage loans were the largest beneficiary.
- Large Life companies earn significantly higher investment yields, and receive less returns in the form of realized or mark-to-market gains. Yields for all insurers declined significantly in 2020.
- There is a strong positive correlation between Life insurer size and balance sheet leverage.
Conclusions
The question of “are insurers increasing allocations to risk assets to offset low bond yields?” has been perennial in the recent years. Articles on this question often answer in the affirmative, though there’s little sign in the data of any broad movement towards increased risk exposure since 2016 (admittedly this period included a phase of improving bond yields). We believe a more accurate conclusion would be that insurer asset allocations are impressively stable from year to year, and it’s likely that small year-to-year fluctuations in e.g. equity exposure are mainly driven by organic changes in market value rather than strategic reallocations. The largest asset shift in recent years across all industries seemed to be the growth of cash in 2020, likely due to the challenging investment environment that prevailed at year-end of richly valued equities and record-low bond yields.
Overall, we believe this suggests a commendable degree of investment discipline among insurers, reflecting neither aggressive overreach to offset declining bond yields, nor conservative de-risking in response to years of unprecedentedly rapid gains in risky assets. Ultimately regardless of size or business lines, we believe all insurers would be well advised to identify strategic asset allocations tied to their return objectives and tolerance for surplus volatility, and stay the course during periods of volatility rather than chasing strong returns after the fact, or selling at the bottom of a decline.
Note: All data sourced from S&P Global Market Intelligence, as of 12/31/20. P&C data based on 801 companies with minimum 3yrs operating history and invested assets >$10 million. Life data based on 283 insurers with minimum 3yrs operating history and invested assets >$10 million. Observations and conclusions are that of AAM and are subject to change should market conditions warrant. Please see attached data which is an integral part of the paper.
Appendix
Property and Casualty

Life

Disclaimer: Asset Allocation & Management Company, LLC (AAM) is an investment adviser registered with the Securities and Exchange Commission, specializing in fixed-income asset management services for insurance companies. Registration does not imply a certain level of skill or training. This information was developed using publicly available information, internally developed data and outside sources believed to be reliable. While all reasonable care has been taken to ensure that the facts stated and the opinions given are accurate, complete and reasonable, liability is expressly disclaimed by AAM and any affiliates (collectively known as “AAM”), and their representative officers and employees. This report has been prepared for informational purposes only and does not purport to represent a complete analysis of any security, company or industry discussed. Any opinions and/or recommendations expressed are subject to change without notice and should be considered only as part of a diversified portfolio. Any opinions and statements contained herein of financial market trends based on market conditions constitute our judgment. This material may contain projections or other forward-looking statements regarding future events, targets or expectations, and is only current as of the date indicated. There is no assurance that such events or targets will be achieved, and may be significantly different than that discussed here. The information presented, including any statements concerning financial market trends, is based on current market conditions, which will fluctuate and may be superseded by subsequent market events or for other reasons. Although the assumptions underlying the forward-looking statements that may be contained herein are believed to be reasonable they can be affected by inaccurate assumptions or by known or unknown risks and uncertainties. AAM assumes no duty to provide updates to any analysis contained herein. A complete list of investment recommendations made during the past year is available upon request. Past performance is not an indication of future returns. This information is distributed to recipients including AAM, any of which may have acted on the basis of the information, or may have an ownership interest in securities to which the information relates. It may also be distributed to clients of AAM, as well as to other recipients with whom no such client relationship exists. Providing this information does not, in and of itself, constitute a recommendation by AAM, nor does it imply that the purchase or sale of any security is suitable for the recipient. Investing in the bond market is subject to certain risks including market, interest-rate, issuer, credit, inflation, liquidity, valuation, volatility, prepayment and extension. No part of this material may be reproduced in any form, or referred to in any other publication, without express written permission.