Are insurance companies missing an opportunity to reduce exposure?
The municipal tax-exempt market has enjoyed particularly strong performance on a year-to-date basis. Through the end of the 2nd quarter, Municipal Market Data (MMD) ‘AAA’ yields have fallen by 65 and 72 basis points (bps) in 10 and 20yr maturities, respectively. Most of this performance can be traced to the strong demand exhibited by the household or retail segment of the market. However, what we have failed to see materialize so far in 2019 is any dramatic shift in institutional demand from insurance companies to take advantage of the increased buying focus across the curve from retail investors.
Sector rotation trade
As we have noted in prior AAM Insight write-ups, the Tax Cut and Jobs Act (TCJA) that passed at the end of 2017 reduced corporate tax rates from 35% to 21%, and in the process reduced tax-adjusted ‘AAA’ yield levels for insurance companies. Our view at AAM since the law was passed has been to target an increase in after-tax portfolio yields by gradually sector rotating out of tax-exempts and into taxable sectors like corporates and taxable municipals during periods of significant relative outperformance by the tax-exempt market.
During 2018, we did this by selling into very strong demand inside of 10yrs. At the time, tax-exempt investors were very concerned about the hawkish tone of the Federal Reserve and the course of rate hikes to the federal funds rate. To mitigate that interest rate risk, there was a significant shift toward reducing duration, with demand heavily focused on moving to the front end of the yield curve. The net results of this demand to the short and intermediate areas of the yield curve were exceptional downward pressure on yields, relative valuation metrics moving to extremely expensive levels and a dramatically steep yield curve on both an absolute and relative basis versus the Treasury yield curve.
Although we reduced a significant amount of our tax-exempt exposure throughout 2018 in maturities inside of 10yrs, the exceptional steepness in the yield curve from 2 to 20yrs provided us with a compelling strategy of maintaining an overweight to maturities 10yrs and longer. Our belief was that investors would eventually identify that the absolute yield levels on the front end of the curve were unattractive and that the compelling steepness in the yield curve would entice investors to move out the curve.
Market rallies on dovish tone from the federal reserve
During 2019, we continued to reduce exposure as technical imbalances developed on the longer end of the yield curve. Very strong demand extended further out the curve into the 15 to 30yr area on the heels of disappointing economic data and FOMC commentary that they would likely halt further rate hikes for the balance of 2019.
Additionally, reduced supply was also a major contributor to the rally. Another casualty of the TCJA tax reform was the elimination of tax-exempt advance refundings. This process allowed for the refinancing of debt more than 90 days before its call date. According to data reported by the Bond Buyer, the repeal of this technique reduced overall municipal supply by over $100 billion in 2018 relative to 2017, and 2019 is running at a similar pace to 2018.
The resulting supply/demand imbalances led to tax-exempt rates falling dramatically across the yield curve. Additionally, the slope of the muni curve from 2 to 20yrs flattened by as much as 35bps on 5/13/19, which also coincided with municipal-to-Treasury ratios in 10yrs falling to an over 25yr low of 70.9%.
Insurance companies added muni exposure during the 1st quarter of 2019
For our insurance company portfolios, we reduced most of our tax-exempt exposure leading into the heart of these technical imbalances and resulting relative outperformance. However, we have noticed that so far in 2019, both property and casualty (P&C) and life companies have been adding exposure. The Federal Reserve’s Flow of Funds Data reported for the 1st Quarter of 2019 shows that municipal bond exposure increased by $5.3 billion and $3.7 billion for P&C and life companies, respectively. By contrast, U.S. banks, which also saw a drastic reduction in their tax-adjusted yields at the new 21% corporate rate, reduced exposure by $7.7 billion during the quarter.
Federal Reserve Flow of Funds
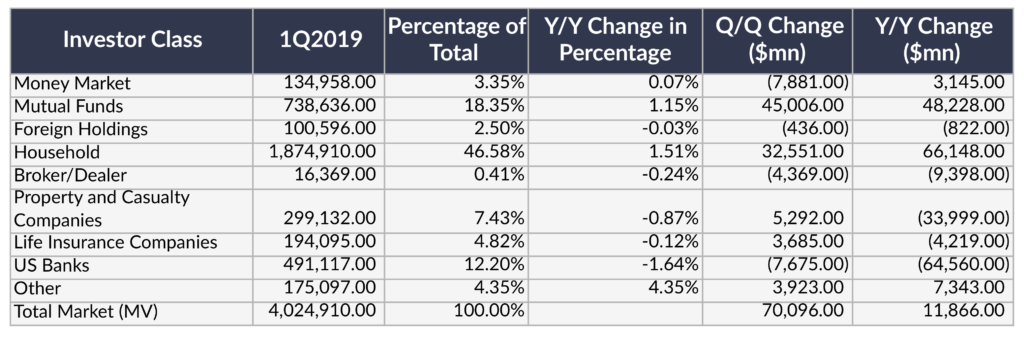
What’s also notable from the flow of funds data is that the retail segment, both households and mutual funds, were drastically increasing exposure during the quarter. With rates falling across the curve, mutual funds and households added $45 billion and $33 billion, respectively. Additionally, it appears that solid retail demand extended into the 2nd quarter. Lipper data shows mutual funds that report on a weekly basis reported inflows that averaged $1.1 billion per week during the quarter.
Based on the flow of funds data, It appears that insurance companies are missing an opportunity to reduce exposure and to feed the strong demand that‘s currently in the market, especially on the long end of the curve. Historically, mutual funds have exhibited a negative correlation with Treasury yield movements. Treasury rates have fallen over 100bps since October of 2018. If we see a reversal of that rate movement, it’s likely that you could see a slowing in momentum of inflows or outflows develop in the 2nd half of 2019. That could potentially remove a very essential source of demand from the market.
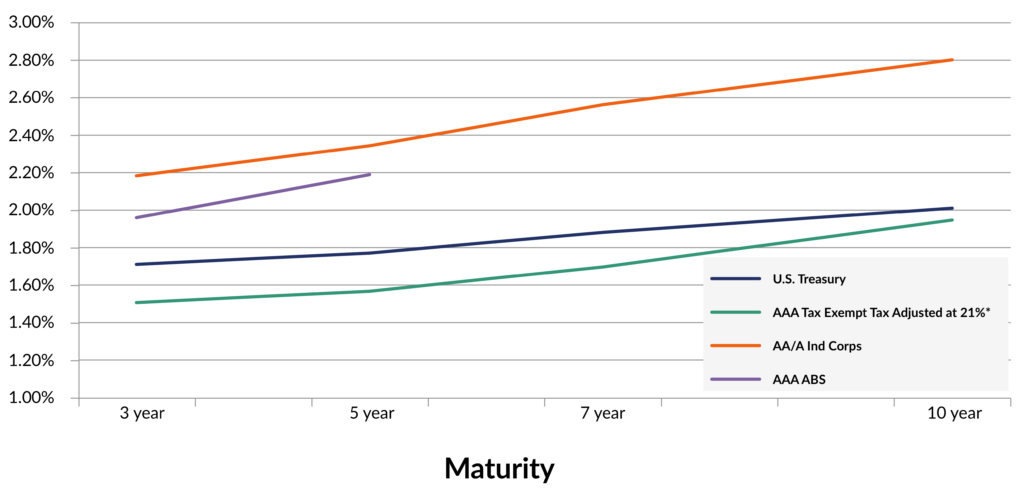
Additionally, with the strong rally in tax-exempts, the sector continues to look over-valued relative to taxable alternatives. Based on MMD data and data compiled by AAM as of 6/30/19, ‘AAA’ tax-adjusted muni yield levels remains well-through that of ‘AA/A’-rated industrial corporates, with yield spreads in 5 and 10yrs at negative 77 and 85bps, respectively. Relative valuation metrics like muni-to-Treasury ratios in 10yrs have moved higher by 10.3 ratios to 81.2%, since they hit their 2019 low point of 70.9% on 5/13/19. However, that ratio level still appears rather expensive compared to the 5yr average of 90%.
Market Yield as of 6/30/2019
On the supply side, there’s also the risk that the tax-exempt market could see a much higher supply cycle, if we see a return of tax-exempt advance refundings. A bipartisan sponsored bill to restore this refinancing technique, H.R. 2772–Investing in our Communities Act, was referred to the House Committee on Ways and Means on 5/15/19. There are 9 Democrats and 6 Republicans listed as co-sponsors on this bill. If it were to pass, given the low rate environment and the flattening in the yield curve, we could see a dramatic increase in supply levels that could result in a substantial weakening in relative valuations for tax-exempts. Given the amount of dysfunction between Congress and the White House, it would appear that there’s a low probability of this bill passing on its own this year, but could find firmer footing if there is a change in the makeup of Congress and the Executive Branch in 2021.
Conclusion
In reviewing the flow of funds data over the last 5 quarters, insurance companies have reduced their exposure to tax-exempts by $43.5 billion to a total of $493.2 billion, which still makes up 12.25% of the overall market. There appears to be a number of persuasive arguments for insurance companies to look at a continuation of reducing exposure further to tax-exempts in the near term. However, given that insurance companies increased their exposure in the 1st quarter of 2019, we are wondering when the actual trading activity and asset repositioning will begin to reflect the compelling sector rotation trade that exists for these investors.
Disclaimer: Asset Allocation & Management Company, LLC (AAM) is an investment adviser registered with the Securities and Exchange Commission, specializing in fixed-income asset management services for insurance companies. Registration does not imply a certain level of skill or training. This information was developed using publicly available information, internally developed data and outside sources believed to be reliable. While all reasonable care has been taken to ensure that the facts stated and the opinions given are accurate, complete and reasonable, liability is expressly disclaimed by AAM and any affiliates (collectively known as “AAM”), and their representative officers and employees. This report has been prepared for informational purposes only and does not purport to represent a complete analysis of any security, company or industry discussed. Any opinions and/or recommendations expressed are subject to change without notice and should be considered only as part of a diversified portfolio. Any opinions and statements contained herein of financial market trends based on market conditions constitute our judgment. This material may contain projections or other forward-looking statements regarding future events, targets or expectations, and is only current as of the date indicated. There is no assurance that such events or targets will be achieved, and may be significantly different than that discussed here. The information presented, including any statements concerning financial market trends, is based on current market conditions, which will fluctuate and may be superseded by subsequent market events or for other reasons. Although the assumptions underlying the forward-looking statements that may be contained herein are believed to be reasonable they can be affected by inaccurate assumptions or by known or unknown risks and uncertainties. AAM assumes no duty to provide updates to any analysis contained herein. A complete list of investment recommendations made during the past year is available upon request. Past performance is not an indication of future returns. This information is distributed to recipients including AAM, any of which may have acted on the basis of the information, or may have an ownership interest in securities to which the information relates. It may also be distributed to clients of AAM, as well as to other recipients with whom no such client relationship exists. Providing this information does not, in and of itself, constitute a recommendation by AAM, nor does it imply that the purchase or sale of any security is suitable for the recipient. Investing in the bond market is subject to certain risks including market, interest-rate, issuer, credit, inflation, liquidity, valuation, volatility, prepayment and extension. No part of this material may be reproduced in any form, or referred to in any other publication, without express written permission.