insight
A Detailed Analysis Into the Fundamental Factors Affecting Crude Oil Prices
December 2, 2014
Excess returns of the energy sector have significantly lagged the investment grade corporate market in 2014 due to the unexpected decline in crude oil prices. Credit profiles of those companies in the energy sector are highly dependent on oil prices and a thorough review of the fundamentals of oil is warranted. In this paper we describe the factors affecting supply and demand of oil. Given that there are many variables affecting both supply and demand, we narrowed our review to the issues we believe will most affect crude oil in 2015: Libyan supply and the recent OPEC decision, Russian production, domestic oil shale production; demand from China, the European Union (EU) and the U.S. We conclude our analysis by reviewing the marginal cost of supply of crude oil, which suggests the floor for prices is about $40 per barrel in a worst case scenario.
The price of oil has declined more than 25% in the past quarter (Exhibit 1) in a pattern that resembles similar moves from 1998 and 2012. In 1998, oil continued to decline for more than a year, only rebounding once OPEC gained discipline and reduced production. In 2012, the price decline was relatively short-lived, as market concerns regarding Europe were offset by the Arab Spring induced supply curtailment. Our opinion is that this decline will resemble the price movements of 2012, not 1998 or 2008.

Libyan Supply
At the beginning of 2014, there were several issues at the center of the debate about Middle Eastern crude oil supply: Libyan production, Iranian sanctions and concerns that the Syrian civil war would spill over to Saudi Arabia and Iran. Given the instability in that region throughout the past three years, it appeared that the risk of a supply disruption was much greater than the prospect of an increase in production.
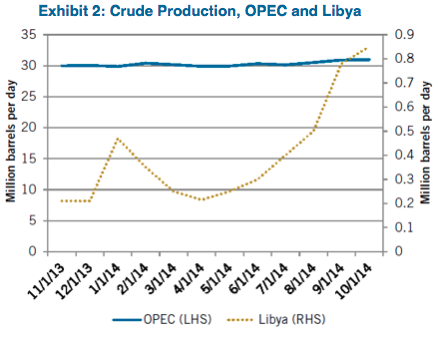
However, OPEC unexpectedly added more than 1 million barrels of oil per day (>1%) to the market since oil prices peaked in June 2014. The country most responsible for adding supply has been Libya, where production increased more than 600,000 per day (Exhibit 2). In our opinion, the big spike in Libyan production is the single biggest factor for the decline in oil prices since June 2014 since it was largely unexpected.
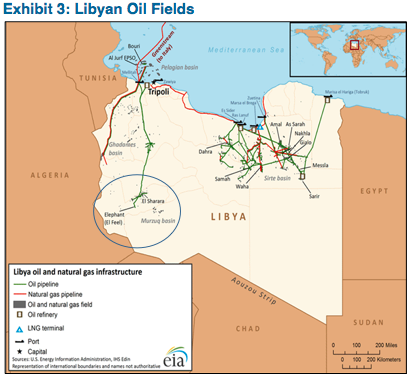
We are skeptical that Libyan production can be maintained at the current 850,000 barrel per day level in 2015 due to the violence in the region along with a lack of financial and human capital devoted to operations. In mid-November, armed opponents of the existing government took control of the country’s largest oil field, the 200,000 barrel per day El Sharara in southwest Libya (Exhibit 3). Additionally, unreliable power to the El Feel field near the Algerian border is curtailing production there.
Furthermore, three of the four largest service companies revealed in their third quarter 2014 earnings call that they are not engaged in Libya currently, which suggests future production will very likely decline. Halliburton management stated, “Libya’s down for the count right now”; Weatherford management commenting on Libya stated, and “Our activity has effectively halted.” Schlumberger management commented that Libya “continues to be challenging with a very complex security situation and with activity remaining at the minimal level. We are currently carefully evaluating our operational structure in the country and will resize resources in accordance with the 2015 activity outlook.” Other operators such as ConocoPhillips and OMV were equally pessimistic about production. As a result, we believe Libyan production, which has averaged about 436,000 barrels per day this year could easily be cut by 20%.
OPEC’s Dilemma
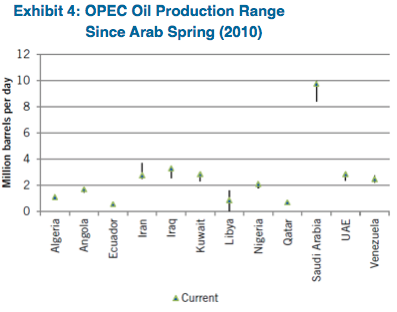
Many believe that a cut in OPEC production will help to stabilize crude oil prices. However, Saudi Arabia has made it clear in recent months that any cuts to OPEC production will have to be multilateral across all members and that it will not be the sole responsibility of the Saudis. This is a difficult proposal to accept for many OPEC members, particularly Iran, Libya and to a lesser extent Iraq. As Exhibit 4 indicates, Iran and Libya are not currently producing near their recent peak capacity. However, Saudi Arabia is still producing at the same high levels as when the Kingdom supported the international community’s release of oil from strategic petroleum reserves to fend off supply fears during the Arab Spring.
Saudi Arabia clearly won the debate with other OPEC members at the semiannual meeting in Vienna on November 27th. OPEC surprisingly kept its oil production quota of 30 million barrels per day unchanged, which implies a cut in actual production of only about 300,000 barrels per day if members adhere to their quotas. We agree with those who have speculated that Saudi Arabia and OPEC are no longer willing to shoulder the burden as a swing producer to higher cost competition. Nevertheless, this is a painful decision for most members of OPEC due to their dependence on oil revenues to meet governmental budgets. Should oil prices remain in the $60 per barrel range for more than one quarter, we expect OPEC to revisit this most recent decision and possibly be joined by non-OPEC members in a production cut.
Russian Supply
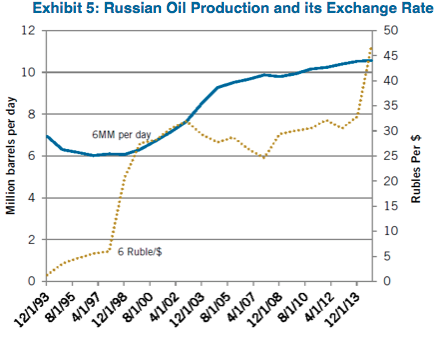
Russia is the third largest producer of oil (including lease condensate) in the world at more than 10 million barrels per day, behind only the U.S. and Saudi Arabia. Given the turmoil in Russia, we believe it is useful to review its production profile from the 1997 to 1999 period when the macroeconomic environment bore some similarities to today. Recall that in 1998, oil prices declined by more than 50% to $10 per barrel, the ruble was under intense pressure and Russia eventually defaulted on its domestic debt. Many had forecast Russian oil production to rise in response to the weaker ruble back then and Russian oil producers wanted to take advantage of this scenario. However, it took a full two years and high oil prices for production from Russia to actually increase as Exhibit 5 suggests.
Not only is Russia facing the macroeconomic headwinds from 20 years ago, it is now also facing sanctions from the U.S. and the EU. On September 12, 2014, the U.S. Treasury imposed sanctions that prohibit the exportation of goods, services (not including financial services), or technology in support of exploration or production for Russian deep water, Arctic offshore, or shale projects that have the potential to produce oil, to five Russian energy companies – Gazprom, Gazprom Neft, Lukoil, Surgutneftegas, and Rosneft – involved in these types of projects. This measure complements restrictions administered by the Commerce Department and is similar to new EU measures published that same day. The weakened ruble, the recently imposed sanctions, historical precedent and much weaker commodity prices suggest Russian production should decline in 2015.
Domestic Supply
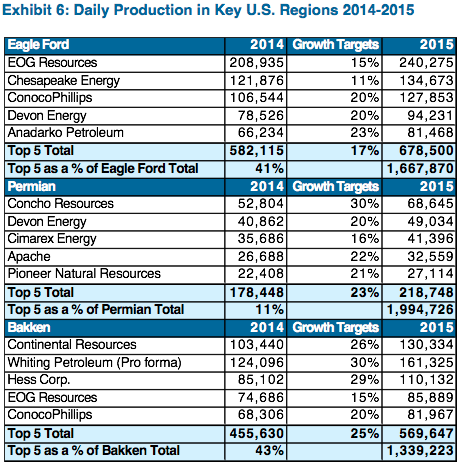
The biggest contributor to worldwide crude production growth in 2014 was the U.S. and more specifically, the Eagle Ford Shale in southern Texas, the Permian Basin in west Texas and the Bakken Shale in North Dakota. While the growth was expected by the marketplace, the efficiency and cost improvements have been surprising. In just over one year, production from these regions has increased by 1 million barrels per day and is largely responsible for U.S. production reaching more than 13 million barrels per day including lease condensate. Moreover, the time to complete the wells is declining as are costs. Based on a bottom up analysis of the key producers in those domestic regions we believe that production should increase by more than 800,000 barrels per day in 2015 (see Exhibit 6), even in a $75 per barrel environment.
Based on the analysis above of the regions we believe will be key in 2015, we are forecasting worldwide production of about 92 million barrels per day, which is basically flat from the second quarter of 2014. In addition to the regions we highlighted above, we believe that modest production growth could come from Canada and Brazil.
Global Demand for Crude Oil
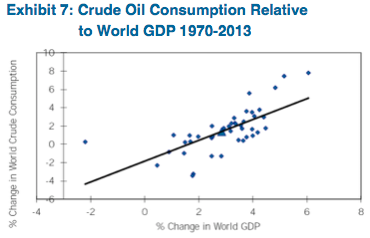
We base our oil consumption forecast on the International Monetary Fund (IMF) worldwide GDP estimate, which for 2015 is 3.8%. Based on data since 1970, about 48% of the variability in oil consumption is explained by changes in GDP, which is shown in Exhibit 7. Using this regression equation, we are forecasting oil consumption of slightly more than 92 million barrels per day in 2014. If worldwide economic growth in 2015 is near 3.8% as the IMF suggested in October 2014, then oil consumption should exceed 93 million barrels per day in 2015. If we use a more conservative 2.8% for 2015 worldwide economic growth, oil consumption would approach 93 million barrels per day.
Many market participants have cast a skeptical eye at the latest growth forecasts out of the IMF due to expected weakness from China and worse than expected results from Europe. In fact, we would not be surprised to see the IMF revise down their 2015 growth forecast in April of next year. However, we note that worldwide economic growth would have to be cut in half from its current estimate for expected oil consumption to be flat from the expected 92 million barrels per day in 2014.
Equally important, since 1970 there have been seven years when year-over-year oil consumption actually declined (1974-1975, 1981-1984 and 2008). The average global economic growth during those years was just under 2% and the U.S. was in recession in five of those seven periods.
China Consumption
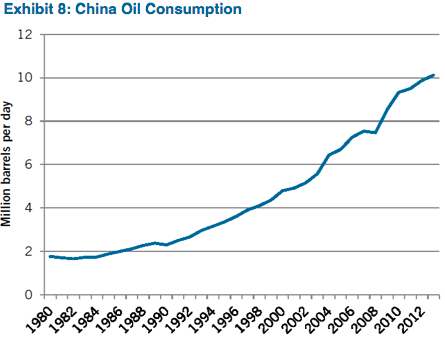
Many market participants are concerned about China demand and justifiably so as current China oil consumption represents a larger percentage (11%) of global demand than any other time in history. As shown in Exhibit 8, Chinese consumption has been increasing since the late 1980’s. While there have been five occasions since 1980 when consumption actually decreased year over year, the average decrease was only 60,000 barrels per day and the maximum decrease was 83,000 barrels per day in 1990.
We are of the opinion that the pace of China’s economic growth will slow, (the IMF estimate of 7.3% seems high, but it’s still growth). Similarly, we believe that Chinese oil demand may not grow meaningfully in 2015, but we are skeptical that consumption will actually decline by a substantial amount.
EU Consumption
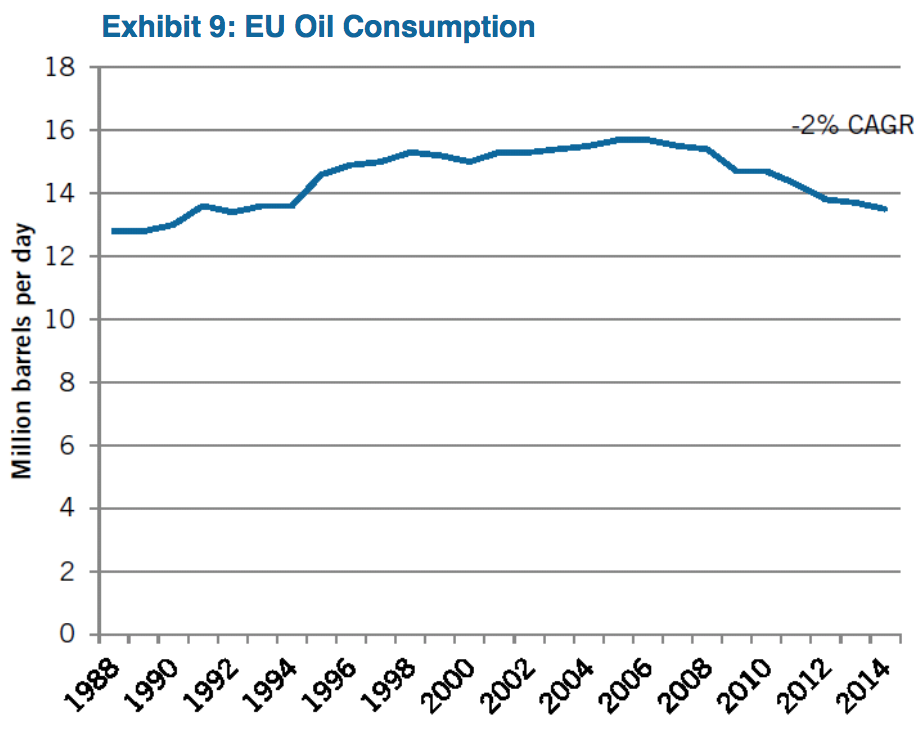
The data suggests that consumption from the EU is deteriorating the most of all regions, with demand in 2014 about 200,000 barrels per day lower than the previous year. Estimating EU consumption using historical data is difficult because there is a limited track record of EU GDP and oil consumption. Moreover, the correlation coefficient between the two variables is weak, making predicting future demand based on economic growth impractical. Nevertheless, our estimate is based on the recent trend, which suggests consumption may be 250,000 barrels per day lower in 2015.
U.S. Consumption
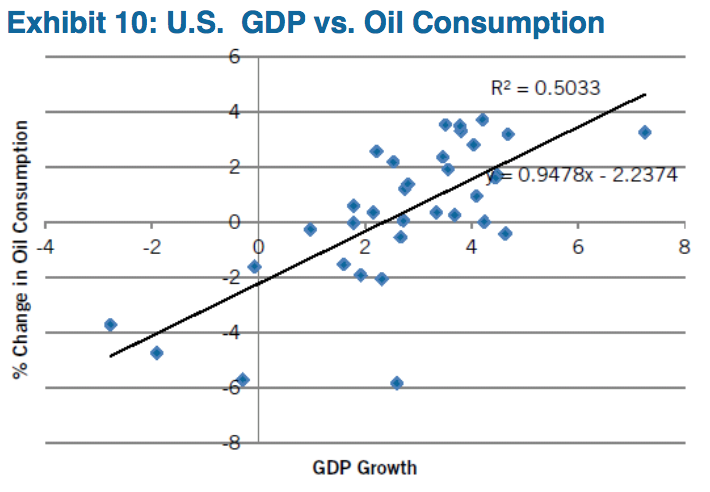
The U.S. is the largest consumer of oil in the world at 19 million barrels per day and its consumption is largely influenced by economic growth. Exhibit 10 shows the relationship between economic growth and oil consumption in the U.S. Since 1980, there has been only one year in which economic growth in the U.S. was at least 3% and oil consumption did not increase – that was 1983. Based on the regression analysis of data from the last 35 years, consumption should increase as long as U.S. GDP is at least 2.4%. In fact, AAM expects the U.S. economy to grow 3% in 2015, which implies that oil consumption in the U.S. should rise by about 100,000 barrels per day.
Marginal Cost of Supply
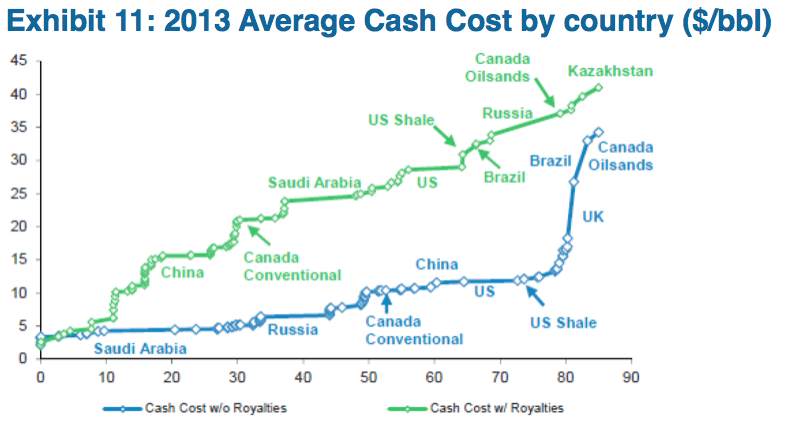
The pace at which oil prices have declined from the recent peak clearly suggests that the market believes that either supply is much greater and/or demand is much less than 92 million barrels per day. An analysis of marginal cost of supply of crude oil provides investors a basis to understand at which price point existing production becomes unprofitable. While we are not forecasting a scenario where production has to be “shut-in,” a review of marginal cost of supply is worthwhile (Exhibit 11). The chart describes the cumulative worldwide production along the X-axis, the marginal cost of supply on the Y-axis and the cost of an existing producing well in these different regions. Though capital might stop flowing to new exploratory efforts in a sub-$70 per barrel environment affecting future production, Exhibit 11 shows that oil would have to decline to $50, before current production from Kazakhstan and the Canadian oil sands wells would be uneconomic.
Based on the above analysis, we believe supply in 2015 will approximate 92 million barrels per day and demand should be at least 92 million barrels of oil per day, which is supportive for crude oil prices. Many domestic companies recently described in detail their production plans for 2015, which we believe they will achieve adding to overall supply. However, we are concerned that the instability in Libya and economic conditions in Russia will more than offset the domestic supply gains. We expect oil consumption to rise in 2015 based on a conservative economic growth forecast of 2.8% versus the International Monetary Fund’s 3.8%. While European consumption will continue to contract, Chinese and U.S. consumption should mitigate that loss.
Patrick McGeever
Senior Analyst, Corporate Credit
For more information, contact:
Colin T. Dowdall, CFA
Director of Marketing and Business Development
colin.dowdall@aamcompany.com
John Olvany
Vice President of Business Development
john.olvany@aamcompany.com
Neelm Hameer
Vice President of Business Development
neelm.hameer@aamcompany.com
Disclaimer: Asset Allocation & Management Company, LLC (AAM) is an investment adviser registered with the Securities and Exchange Commission, specializing in fixed-income asset management services for insurance companies. This information was developed using publicly available information, internally developed data and outside sources believed to be reliable. While all reasonable care has been taken to ensure that the facts stated and the opinions given are accurate, complete and reasonable, liability is expressly disclaimed by AAM and any affiliates (collectively known as “AAM”), and their representative officers and employees. This report has been prepared for informational purposes only and does not purport to represent a complete analysis of any security, company or industry discussed. Any opinions and/or recommendations expressed are subject to change without notice and should be considered only as part of a diversified portfolio. A complete list of investment recommendations made during the past year is available upon request. Past performance is not an indication of future returns.
This information is distributed to recipients including AAM, any of which may have acted on the basis of the information, or may have an ownership interest in securities to which the information relates. It may also be distributed to clients of AAM, as well as to other recipients with whom no such client relationship exists. Providing this information does not, in and of itself, constitute a recommendation by AAM, nor does it imply that the purchase or sale of any security is suitable for the recipient. Investing in the bond market is subject to certain risks including market, interest-rate, issuer, credit, inflation, liquidity, valuation, volatility, prepayment and extension. No part of this material may be reproduced in any form, or referred to in any other publication, without express written permission.
Disclaimer: Asset Allocation & Management Company, LLC (AAM) is an investment adviser registered with the Securities and Exchange Commission, specializing in fixed-income asset management services for insurance companies. Registration does not imply a certain level of skill or training. This information was developed using publicly available information, internally developed data and outside sources believed to be reliable. While all reasonable care has been taken to ensure that the facts stated and the opinions given are accurate, complete and reasonable, liability is expressly disclaimed by AAM and any affiliates (collectively known as “AAM”), and their representative officers and employees. This report has been prepared for informational purposes only and does not purport to represent a complete analysis of any security, company or industry discussed. Any opinions and/or recommendations expressed are subject to change without notice and should be considered only as part of a diversified portfolio. Any opinions and statements contained herein of financial market trends based on market conditions constitute our judgment. This material may contain projections or other forward-looking statements regarding future events, targets or expectations, and is only current as of the date indicated. There is no assurance that such events or targets will be achieved, and may be significantly different than that discussed here. The information presented, including any statements concerning financial market trends, is based on current market conditions, which will fluctuate and may be superseded by subsequent market events or for other reasons. Although the assumptions underlying the forward-looking statements that may be contained herein are believed to be reasonable they can be affected by inaccurate assumptions or by known or unknown risks and uncertainties. AAM assumes no duty to provide updates to any analysis contained herein. A complete list of investment recommendations made during the past year is available upon request. Past performance is not an indication of future returns. This information is distributed to recipients including AAM, any of which may have acted on the basis of the information, or may have an ownership interest in securities to which the information relates. It may also be distributed to clients of AAM, as well as to other recipients with whom no such client relationship exists. Providing this information does not, in and of itself, constitute a recommendation by AAM, nor does it imply that the purchase or sale of any security is suitable for the recipient. Investing in the bond market is subject to certain risks including market, interest-rate, issuer, credit, inflation, liquidity, valuation, volatility, prepayment and extension. No part of this material may be reproduced in any form, or referred to in any other publication, without express written permission.