Economic Outlook – Marco Bravo, CFA | Senior Portfolio Manager
Market Outlook – Reed Nuttall, CFA | Chief Investment Officer
Corporate Credit – Elizabeth Henderson, CFA | Director of Corporate Credit
Structured Products – Scott Edwards, CFA | Director of Structured Products
Municipal Market – Gregory Bell, CFA, CPA | Director of Municipal Bonds
High Yield – Scott Skowronski, CFA | Senior Portfolio Manager
Convertibles – Tim Senechalle, CFA | Senior Portfolio Manager
Economic Outlook
AAM’s macro-economic outlook for 2020 is centered around four key themes: (i) moderate U.S. economic growth, (ii) subdued inflation, (iii) a Federal Reserve on hold, and (iv) Treasury yields staying low. Consensus forecasts have real GDP growth in the U.S. slowing to 1.8% for 2020 from 2.3% in 2019. As shown in Exhibit 1, the projected moderation in GDP growth is due to slightly weaker spending from the consumer, a deterioration in net trade, and lower government spending. Fixed private investment, which includes business spending and residential investment, is expected to improve in 2020 and contribute positively to overall GDP growth.
Exhibit 1: Contribution to GDP Growth
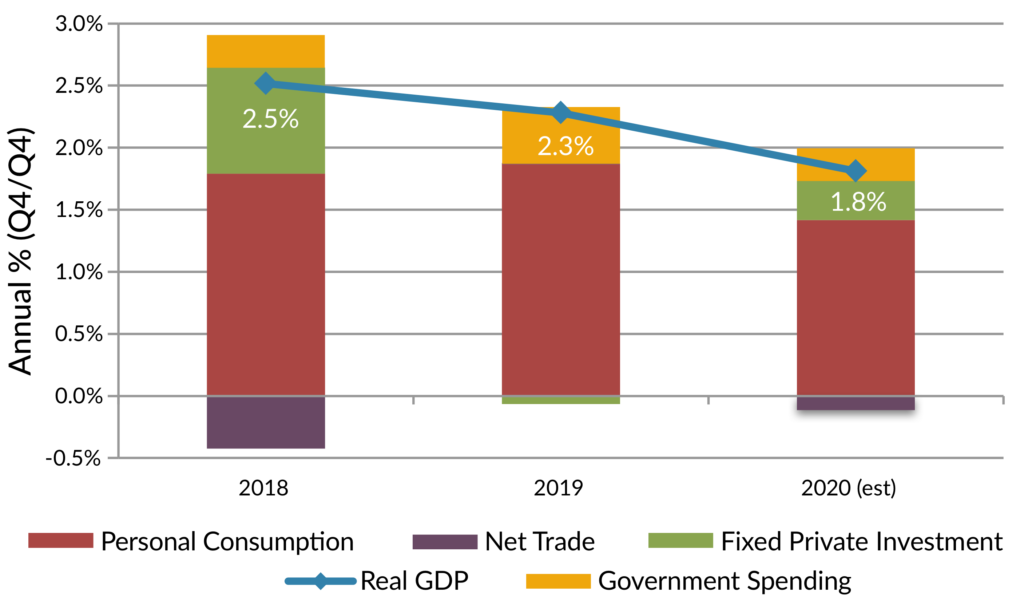
Downside risks to economic growth include uncertainties caused by the U.S./China trade dispute, slowing growth in Europe and China, weaker corporate profits, U.S. elections, and an increase in geopolitical risks. These risks are largely expected to negatively impact manufacturing activity and business spending. The signing of the U.S.-China Phase 1 trade deal along with indications that the weakness in manufacturing activity may be stabilizing are both positive developments as we start 2020. Consumer spending, which is the largest contributor to GDP growth, continues to be supported by a tight labor sector, modest wage gains, low interest rates and household balance sheets that are still in good shape. We expect GDP in the U.S. to increase between 1.5% to 2.5% for 2020 and view the risks to GDP growth as modestly skewed to the upside.
Both headline inflation (Consumer Price Index) and the core PCE Price Index were below the Fed’s 2% target in 2019. After averaging 1.8% last year, the CPI is expected to tick higher and average 2.1% in 2020. Core PCE, the Fed’s preferred measure of inflation, is expected to remain below the Fed’s target and average 1.9% for 2020. With average hourly earnings increasing around 3%, in line with productivity growth and underlying inflation, we don’t see much pressure on inflation to move significantly above the Fed’s 2% target.
The Federal Reserve cut rates three times last year in order to “protect the U.S. expansion in the face of rising downside risks from trade tensions and slowing global growth.” With those risks having subsided to some degree and inflation expected to remain subdued, we see no impetus for the Fed to either lower rates further or reverse course and begin raising rates under its current monetary policy framework. This view is not shared by the consensus which is calling for one rate cut this year, most likely following the November elections. Moreover, around mid-year 2020, the Fed is expected to finish a review of its “monetary policy strategy, tools and communication practices,” which could present new factors for the market to digest, increasing uncertainty and volatility.
Treasury yields, according to consensus forecasts, are expected to move modestly higher from current levels. The benchmark 10-year Treasury yield is forecasted to end 2020 at 2.0% based on the median forecast among economists. With manufacturing sentiment indicators outside the U.S. showing signs of stabilizing, sovereign bond yields have moved off their lows and could put pressure on U.S. yields to move higher. In addition, higher yields outside the U.S. could weaken the U.S. dollar and reduce the deflationary impact from a strong currency, which could steepen the yield curve. We are calling for the 10-year Treasury yield to end the year around the consensus estimate of 2%.
Market Outlook
Exhibit 2
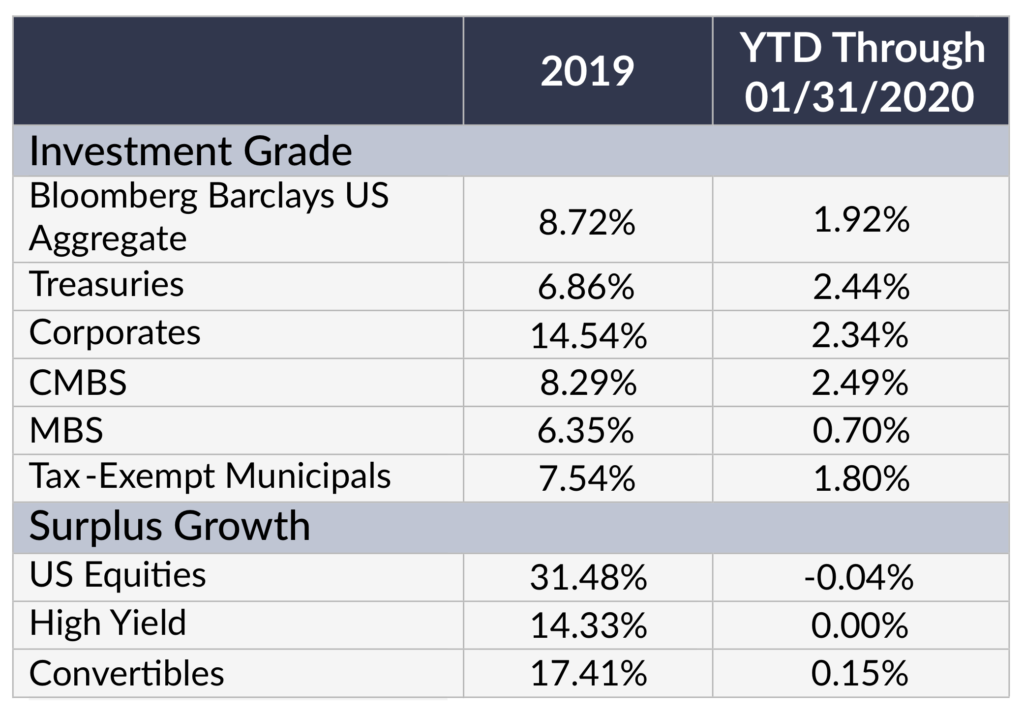
2019 – WOW, what a great year to be an investor! 2019 started with a bang, after a horrible 4Q2018 driven primarily by the Federal Reserve raising rates for the fourth time in the year all while economic indicators slowed. The Fed seemed tone deaf as they expected four more hikes in 2019, sending the market into a late-year panic in 2018. However, the Fed quickly backtracked in early 2019. This accommodative posture from the Fed effectively reversed the spread widening and equity market sell-off in 4Q2018, putting all U.S. markets on track for stellar returns. With the Fed cutting rates three times in July, September, and October respectively, the outlook for risk assets improved significantly. There were several factors of concern; Primary among them was the effect of the tariffs and the tweets about tariffs. As the U.S.-China Phase 1 trade deal was nearing completion, the last major hurdle for performance in 2019 was put aside. This resulted in a strong Q4 and put 2019 equity market returns over 30%, while the broad fixed income market returned 8.72% with the corporate bond sector leading the way.
2020 – We’re off to a good start. However, the coronavirus outbreak and the resulting selloff in equities, commodities, and other risk assets sends a clear message that the markets are fragile; With the markets seemingly priced to perfection, it doesn’t take much to disrupt them. We expect stable albeit low GDP growth this year and a Fed that will be accommodative should U.S. growth falter. Although we have a benign credit outlook, with spreads at these tight levels there is limited upside in taking an aggressive position by adding low quality credits. We continue to recommend the focus on security selection and credit quality in this tight spread environment.
With a stable economy, very low interest rates, and limited inflation, we are particularly cautious about Treasury yield fluctuations due to a flight to quality or change in inflation expectations. We have positioned our portfolios with limited call or extension risk to take advantage of sudden changes in the yield curve. Over the last two years, having an underweight to MBS has been profitable as yield levels have been volatile.
Since we expect a stable economy and strong technical factors, this should be a good year for the equity markets. We are working with our clients to ensure that portfolios have been rebalanced in accordance with strategic targets.
Corporate Credit
2019 was a record year for markets, and the investment grade (IG) corporate bond market was no exception. Its 6.8% excess return over similar maturity Treasuries exceeded expectations, due largely to the technical support related to more dovish central banks in the U.S. and Europe as well as China. The corporate IG Option Adjusted Spread (OAS) tightened 60 basis points (bps) to 93 bps, nearing its 10-year minimum of 85 bps realized in early 2018 and approaching 1.5 standard deviations below its 10-year average.
Exhibit 3: U.S. Corporate Investment Grade OAS
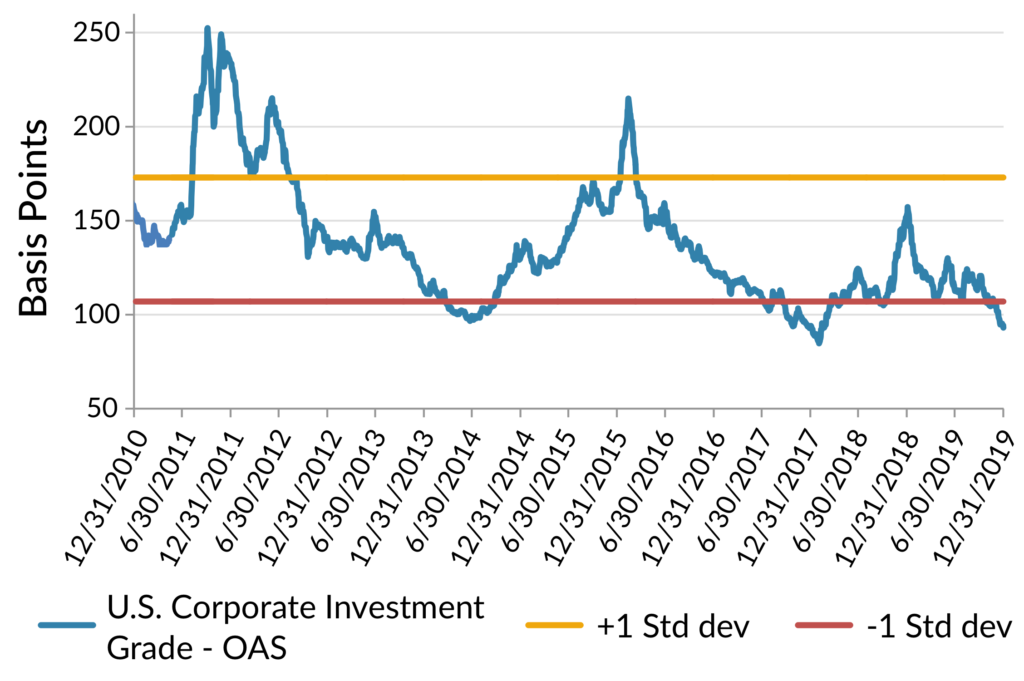
While the 25-year adjusted corporate market OAS averages 135, in times of technical support (rates, QE/liquidity) and fundamental stability, it is lower. Those periods are often in the later stage of the economic cycle; for example, 2003-2006 and 1995-1997. We expect this dynamic to largely repeat itself in 2020, due to our expectation for lower net corporate bond supply, stable interest rates, and ample central bank support and liquidity globally. However, there are outsized risks that are likely to increase market volatility including but not limited to uncertainty regarding the U.S. election and foreign policy as well as the Federal Reserve’s monetary policy goals. The coronavirus is a recent example, and IG spreads to start the year are close to 10 bps wider. Our expectation is for slightly wider spreads by year-end 2020, with an OAS ranging from 103-123.
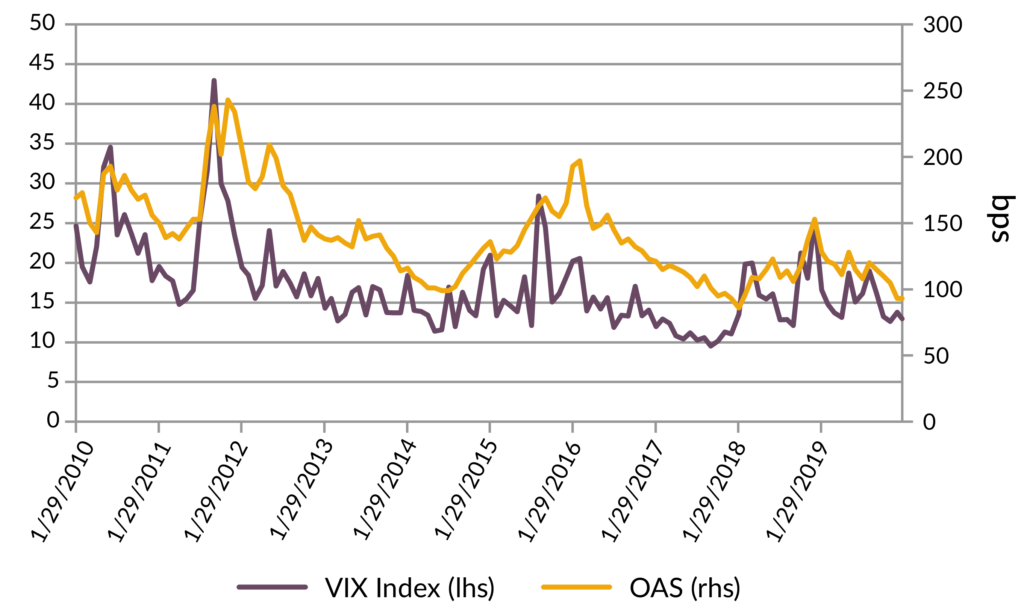
Exhibit 4: OAS and VIX Highly Correlated
AAM expects credit fundamentals to be largely stable in 2020. After years of increasing and elevated debt leverage, we expect leverage to marginally improve as companies work to deleverage in line with rating agency targets and uncertainty keeps companies financially disciplined. Companies with higher credit ratings and lower projected growth are more likely to take advantage of low rates to increase debt leverage vs. those rated in the ‘BBB’ category. The uncertainty in regards to the U.S. election and foreign policy should keep M&A activity muted at least for the first nine months. For example, the latest Duke CFO Survey continues to point to a high risk of a U.S. recession in the next 12-18 months, causing firms to focus on building liquidity and lowering debt balances and costs while remaining cautious on capital investment. We expect continued asset sales and divestitures for investment grade companies, which could increase debt issuance in markets such as high yield and loans. Lastly, we expect increased shareholder activism and investor attention on ESG related matters to continue in 2020.
We expect revenue growth to increase in 2020 by 4-5% on average as industrial, manufacturing, and technology sectors benefit from stable-to-improved economies globally and a normalization of inventory levels. Consumer related sectors are expected to grow 1-3% given the high degree of competition and supply for the level of demand. EBITDA and earnings are projected to grow 8-9%, with capital spending growing 2-3%. Technology oriented firms should grow at a much faster pace after the rationalization of inventories in 2019 vs. orders as well as the ramp expected in 5G related spending. Conversely, the other end of the growth spectrum includes industries that are still oversupplied for the level of demand – industries such as autos and construction machinery. Accordingly, we expect more capital investment from technology and communication services companies with little to no growth in capital investment from traditional industries like manufacturing and energy. The main risk to this forecast is lower than expected growth from overseas and/or the U.S., reigniting recession concerns.
The technical outlook for the corporate market remains favorable, with gross and net debt issuance expected to be lower in 2020 vs. 2019. This is consistent with our fundamental outlook related to deleveraging and capital spending. Lower debt supply coupled with strong demand from foreign investors and insurance companies suffering from low relative yields should support spreads. A risk to this forecast relates to rate volatility and/or the shape of the yield curve (bear flattening in particular). We are biased to the intermediate part of the curve given the lack of absolute value on the long end. ‘BBB’ rated firms remain fairly valued on average vs. higher rated peers. This, in addition to our expectation for deleveraging and modest spread widening for the market, causes us to prefer higher rated BBB securities.
After two years of systemic risk driving credit spreads, we expect idiosyncratic risk to drive portfolio performance in 2020. In general, we recommend prioritizing defensive sectors due to our expectation for modestly wider spreads from low levels to start 2020.
Exhibit 5: AAM Sector Outlook for 2020

Structured Products
Unlike 2018 when most sub-sectors of the structured product universe underperformed Treasuries, 2019 was a year when you were well-rewarded for taking risk. All sectors of the structured market outperformed similar maturity Treasuries some by the widest margins in years. Commercial mortgage backed securities (CMBS) were the best performing sub-sector far outpacing agency mortgage backed securities (RMBS) and asset backed securities (ABS). As we look to 2020, generating excess returns over Treasury benchmarks and other risk assets is going to be far more challenging as spreads have compressed to multi-year lows leaving risk priced at much less attractive levels.
After trailing its Treasury benchmarks through much of 2019, RMBS had a stellar fourth quarter generating 63bps of excess returns, the highest annual excess return since 2013. Fed easing and an overall drop in volatility helped propel returns. We believe last year’s performance has left valuations in a relatively unattractive range and anticipate significantly lower returns in the coming year. In addition to poor valuations, the market must also contend with the significant supply generated from the runoff of the Federal Reserve’s $1.4 trillion mortgage portfolio. It’s anticipated that their portfolio will contribute $238 billion in new RMBS, representing over 80% of the forecast net new supply for the year. Given the poor technical positon of the market and tight spread to Treasuries, we will continue to underweight agency RMBS in our portfolios.
Non-agency RMBS, however, remain an important component of our portfolios despite valuations being somewhat less compelling than prior years. Credit fundamentals in the sector still look very good, and since underwriting continues to be very conservative, we anticipate the sector outperforming agency RMBS and, to a lesser extent, Treasuries this year. Housing price appreciation should slow to roughly 3.0% from roughly 3.5% last year; however, we don’t anticipate that it will negatively impact the market. With the consumer being in such excellent financial shape due to low unemployment of 3.5% and wage growth of 2.9%. As a result, delinquency and default rates should remain at very low levels. If we have a concern about the sector it would be the relatively rapid prepayments experienced during the fourth quarter of last year. With mortgage rates stabilizing, we expect prepayments to slow relative to agency securities supporting non-agency valuations.
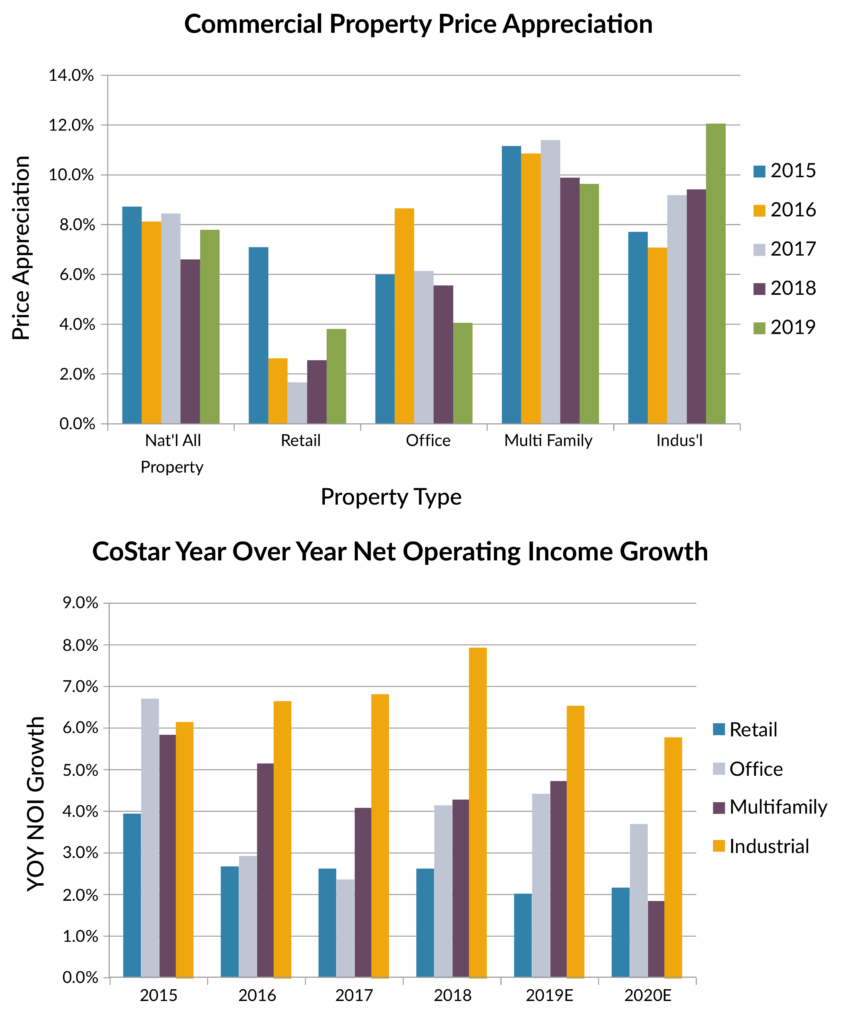
Commercial real estate fundamentals remain in relatively good shape following multiple years of property price appreciation and domestic economic strength. Overall price levels for commercial properties increased in excess of 8% last year, lead by multifamily and industrial properties, and operating income increased on average by 3% or more. While CMBS was the best performing sector within structured products, they could not keep pace with A-rated corporate bonds which generated more than twice the excess return. In most years, senior conduit CMBS securities tend to track spreads on single A-rated corporate bonds fairly closely. We are anticipating heightened volatility within the corporate sector this coming year and expect CMBS will track corporate bond spreads but with less volatility. When combined with current valuation, we expect CMBS should modestly outperform both Treasuries and single A-rated corporate bonds. Our investment of choice within the sector continues to be conservatively underwritten single asset transactions with low leverage. With spread concessions to conduit securities of approximately 10-15bps, they represent better value at this time. As in prior years we remain concerned about the retail sector, particularly regional malls in less populated areas, which must be carefully analyzed in any conduit securitization.
ABS has been a consistent performer year in and year out, and we don’t envision 2020 being any different. Concerns have been raised about the overall level of consumer debt and the increase in delinquencies, particularly within the auto sector over the past year. Our view is that the consumer is in good shape financially. They continue to maintain healthy balance sheets due to strong job growth, and wage gains while the cost of servicing the growing debt burden is well within historical norms. Delinquencies are normalizing from low levels, returning to levels similar to those experienced well before the Financial Crisis and do not reflect the early stages of a consumer credit crisis. We’ll continue to maintain significant portfolio weightings relative to most benchmarks, particularly at the short end of the yield curve. High credit quality and stable cash flows make ABS an attractive alternative to short corporate credit, taxable municipals, and Treasuries. Our favorite sub-sectors continue to be prime and some select subprime auto, credit card, and equipment transactions.
Exhibit 6
Municipal Market
Our outlook for the tax-exempt municipal sector is negative based on their very expensive valuation levels relative to the taxable fixed income sectors. After exceptionally strong performance to end 2019, municipal-to-Treasury ratios in 10-years started 2020 at 75%, which is 13.5 percentage points below the 5-year average. Additionally, on a tax-adjusted yield basis (21% corporate tax rate adjusted), 10-year tax-exempt yields are 19 basis points (bps) through maturity-matched Treasuries. We view both of these valuation metrics as considerable indicators of the overvalued condition for the sector and, in our view, warrant a significant underweight of the sector for 2020.
Very favorable technicals have provided the major underpinning to the sector’s expensive valuations, and the Tax Cut and Jobs Act of 2017 (TCJA) has been one of the most influential events in exacerbating supply/demand imbalances within the sector since its passage in late 2017. On the supply side, the tax reform’s repeal of tax-exempt advance refundings of existing tax-exempt debt reduced overall tax-exempt issuance in 2019 by $54 billion relative to 2017, per data reported by the Bond Buyer. On the demand side, the TCJA’s imposition of a $10,000 cap on state and local tax (SALT) deductions increased the tax burden on wealthier investors in high-tax states. The higher tax burden, combined with already high marginal tax rates, resulted in an increase in the value of the tax-exemption. The ensuing demand for tax-advantaged assets culminated with a record of $95.5 billion in inflows into tax-exempt mutual funds during 2019, per Lipper Fund Flow data.
We expect many of the drivers for tax-exempt valuation to largely remain in place during 2020, as the probability of any change in the tax code during the year is low given the current split legislative control of Congress. However, for insurance company portfolios, we believe that there are better alternatives in the taxable fixed income sectors, which would include taxable municipals.
We have a more constructive view on the outlook for the taxable municipal sector primarily because of the sector’s significant yield advantage relative to tax-exempt bonds and absolute yield levels that are comparable to the other taxable sectors. When comparing yields of similarly rated taxable municipals to that of tax-exempt bond yields (tax-adjusted at 21% corporate tax), taxable municipals provided compelling additional carry of 80 and 85 bps in 5 and 10-year maturities, respectively. Additionally, in those same maturities, ‘AAA’-rated taxable municipal yields were at comparable yield levels to ‘A’-rated industrial corporate bonds.
We believe that the relative attractiveness of the taxable municipal sector should largely be in place for most of 2020 due to the heavy amount of issuance that’s expected. Estimates from the broker/dealer community is for projected issuance of ~$115 billion, with the majority of this supply a direct result of taxable advance refundings of tax-exempt debt. The dramatic plunge in Treasury rates during 2019 (77bps in 10 years) has helped generate significant savings for refinancings, and issuers have been aggressively pursuing this type of issuance since August. As long as rates remain range bound around current levels, there should be ample opportunities to add exposure to this sector during 2020.
From a fundamental perspective, we do not expect any headline risk to create selling pressure in the space, as we expect credit conditions to remain solid during the year. Income and property tax revenues have been growing at a solid rate during 2019 and are expected to continue going forward. That should bode well for solid fiscal performance for state and local governments.
Exhibit 7: Tax-Exempt Relative Valuation Levels Remain Unattractive for Insurers
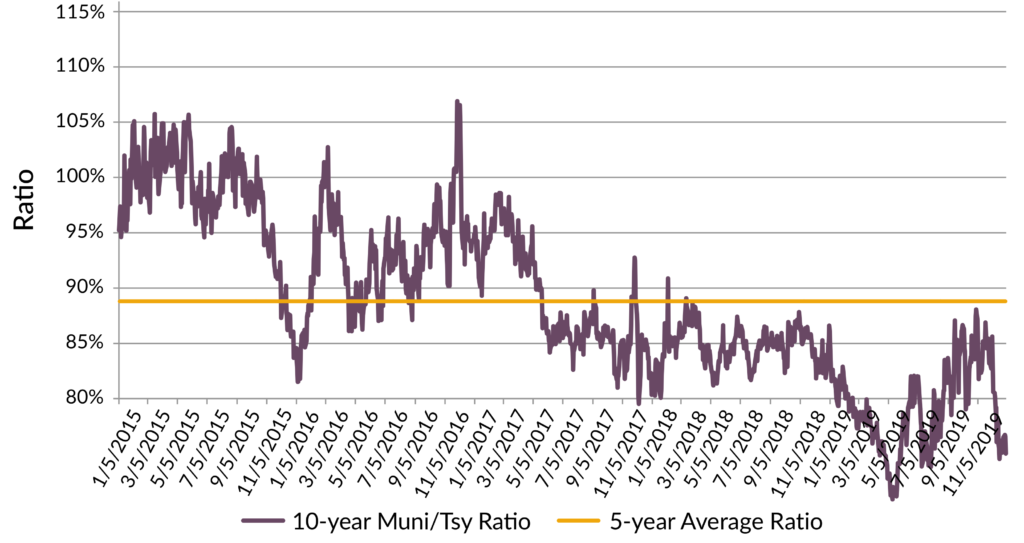
Exhibit 8: Taxable Munis: Compelling Alternative to Tax-Exempts
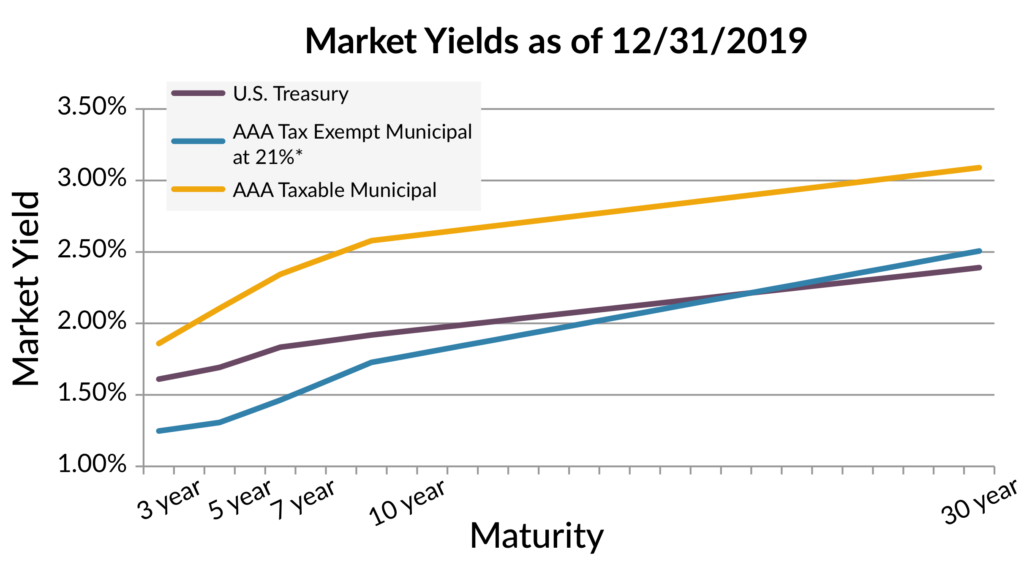
*Tax-exempt yields are grossed-up using a factor of 1.19968, which corresponds to a 21% corporate tax rate.
High Yield
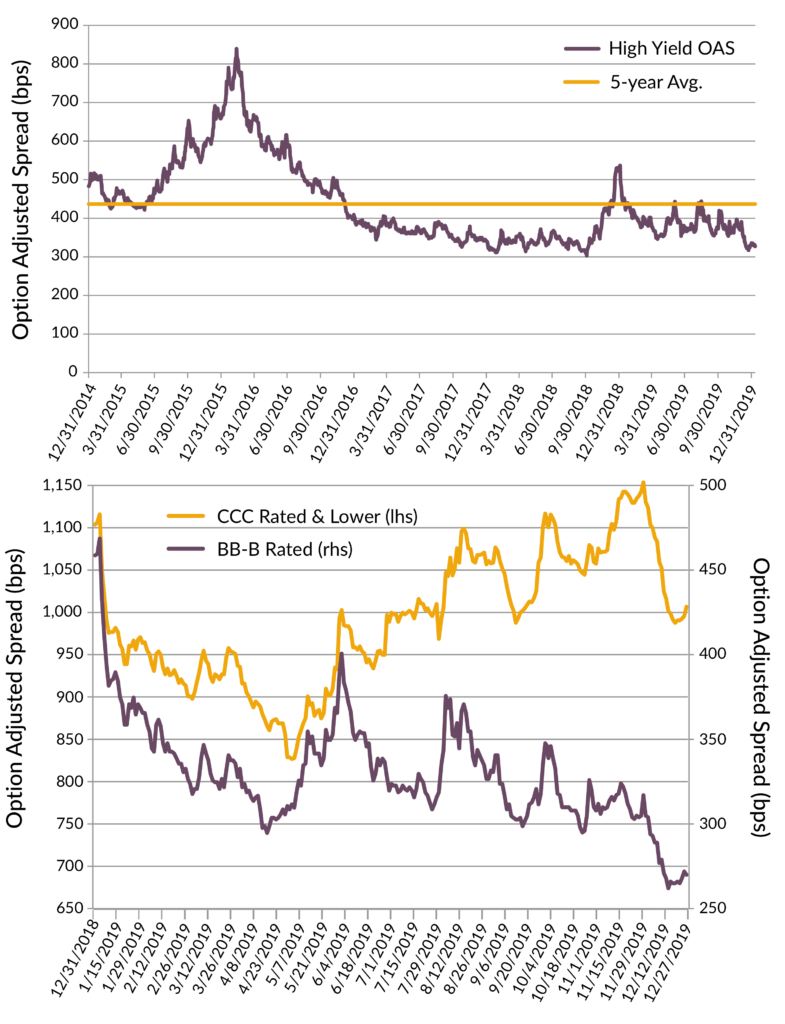
2019 was a strong year for U.S. high yield overall. The sector benefited from stable fundamentals, an improved economic outlook, and strong technicals as the high yield market shrinks while the appetite for yield persists. Credit spreads tightened significantly during the year to levels nearing the five year low of +300. Total returns were 14.3% for the U.S. high yield broad market, with higher quality and longer duration segments outperforming as the BB-B-rated index returned 15.1% for the year while CCC-rated, and lower only returned 9.3%. Loans returned 9% in 2019 which significantly trailed bonds given their limited duration amid falling rates and slowing demand for the floating rate asset class.
Exhibit 9: Historical High Yield Credit Spreads (OAS)
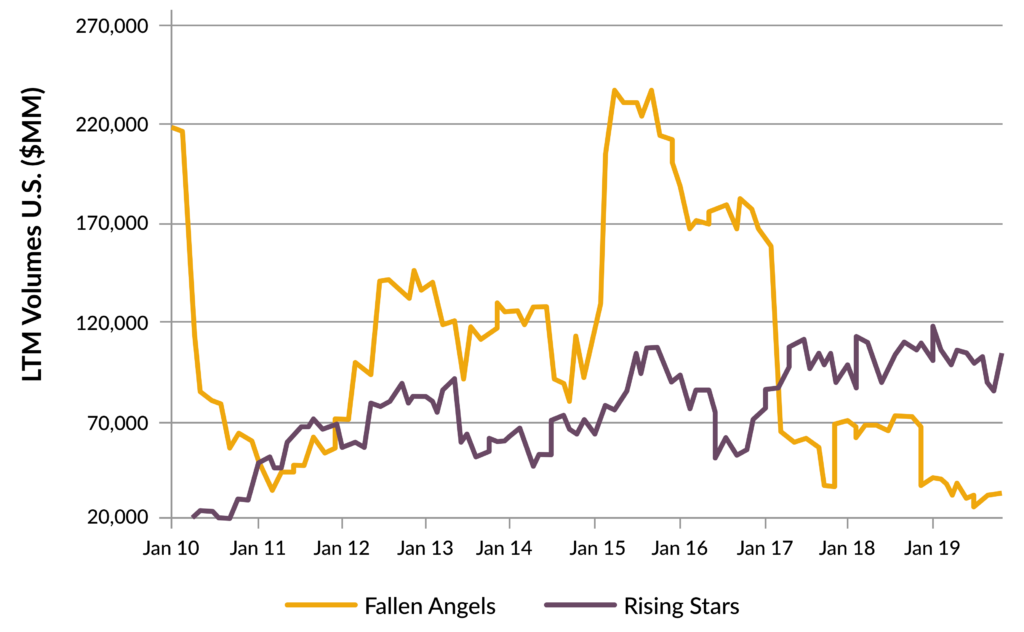
Fundamentally, leverage rose in 2019 but was limited to a few sectors, and interest coverage overall remains healthy. The twelve month U.S. speculative grade default rate increased modestly to 4.2% in 2019. However, it remains below the long-term average of 4.9%. The outlook improves in 2020 as defaults are expected to decline modestly to a rate of 3.5%. In addition, ‘rising stars’ continue to outnumber ‘fallen angels.’ We believe investors should avoid the lowest quality credits as the bifurcation between the lowest and highest quality issuers is likely to continue. It’s imperative to actively manage credit risk to in this environment in order to minimize exposure to issuers and sectors that are likely to be pressured in periods of slower economic growth.
Exhibit 10: Historical Global High Yield Fallen Angels and Rising Stars
While valuations appear tight, further spread compression may be possible as we expect the strong technical backdrop to continue in 2020, with persistent demand for positive yielding credit in a world where negative yielding assets are abundant. Nevertheless, a large proportion of credit market performance in 2019 came from interest rate duration, which benefited from the fall in yields; a repeat performance in 2020 is unlikely. BB-B bond yields have fallen closer to 4.5%, while bank loans yields remain near 5.5%. We believe the relative value argument may be more balanced in favor of loans in 2020, as there is less to gain from long duration positioning and more focus on carry going forward.
Convertible Securities
The record setting rally in equity and credit markets fueled outstanding 2019 performance for balanced convertible investors. The Barclays Balanced Convertible Composite rallied 22.1% as an underlying equity advance of 32.8% pushed conversion values higher during the period. The asset class continues to benefit from its significant exposure to technology companies which represent approximately 35% of the U.S. convertible market as of 12/31/2019 and were the top performing subsector during the year.
Exhibit 11: U.S. Convertibles and Underlying Equity Performance By Sector
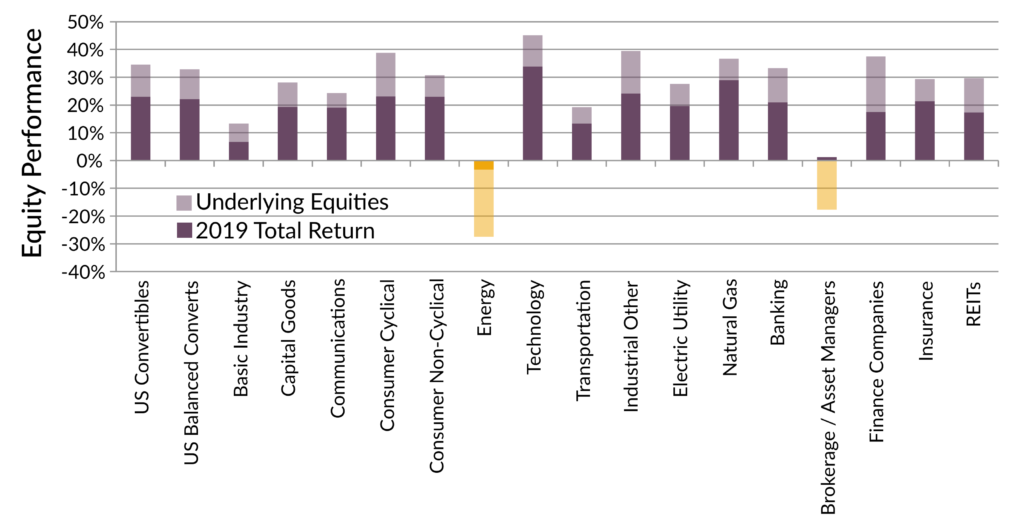
Total return values do not incorporate fees and other advisory expenses.
New issue supply in the convertible market has been robust, with nearly $60B of issuance during 2019 – the largest annual total since 2008. Increased supply coupled with reduced redemption activity led to an increase in notional convertibles outstanding in the U.S. market, a healthy indicator for those seeking balanced risk/reward structures. High equity prices, low rates, and reduced interest deductibility for high yield borrowers have been supportive of this increased deal flow, and AAM’s market outlook suggests another year of sizeable issuance. A number of U.S. and European banks have recently issued synthetic convertibles. This structure consists of the bank as the credit and a conversion feature into a different underlying equity. These sizeable investment grade issues are a welcome addition to the market, but the synthetic nature results in new issue pricing that is generally less attractive to traditional issuance and non-rated secondaries.
The incredible momentum in technology and growth names during the rally has increased certain risks in the convertible market as a whole, which should favor active and disciplined portfolio managers if negative surprises emerge:
- Equity sensitivity has increased with an average investment premium of 66% for the broad market indicating greater downside risk in a market decline
- Continued technology issuance and rising share prices have increased concentration risks in the broad market
- The broad market’s average rating has gradually declined to an estimated mid/low BB
Diversified portfolios of balanced convertible securities offer a unique value proposition that falls in the favor of investors: better upside participation relative to downside risk exposure. Through market cycles, this asymmetry produced equity-like average returns with substantially reduced volatility relative to underlying stocks. We recognize that the post-crisis capital market environment of the past decade has lacked sustained downward movements. Only three of the past forty quarters have registered a negative S&P 500 total return.
Our base case market outlook suggests a stable environment for risk investors in 2020, which should result in positive equity market returns and corresponding gains for convertible investors. In this environment, convertible returns will likely exceed fixed income but trail direct equity returns. Should negative surprises occur, diversified and balanced convertible strategies will dramatically outperform equities and likely broad convertible indices. We will remain patient and disciplined in our approach, continuing to harvest gains where appropriate and using new issue supply to maintain the asymmetry that we desire.
Disclaimer: Asset Allocation & Management Company, LLC (AAM) is an investment adviser registered with the Securities and Exchange Commission, specializing in fixed-income asset management services for insurance companies. Registration does not imply a certain level of skill or training. This information was developed using publicly available information, internally developed data and outside sources believed to be reliable. While all reasonable care has been taken to ensure that the facts stated and the opinions given are accurate, complete and reasonable, liability is expressly disclaimed by AAM and any affiliates (collectively known as “AAM”), and their representative officers and employees. This report has been prepared for informational purposes only and does not purport to represent a complete analysis of any security, company or industry discussed. Any opinions and/or recommendations expressed are subject to change without notice and should be considered only as part of a diversified portfolio. Any opinions and statements contained herein of financial market trends based on market conditions constitute our judgment. This material may contain projections or other forward-looking statements regarding future events, targets or expectations, and is only current as of the date indicated. There is no assurance that such events or targets will be achieved, and may be significantly different than that discussed here. The information presented, including any statements concerning financial market trends, is based on current market conditions, which will fluctuate and may be superseded by subsequent market events or for other reasons. Although the assumptions underlying the forward-looking statements that may be contained herein are believed to be reasonable they can be affected by inaccurate assumptions or by known or unknown risks and uncertainties. AAM assumes no duty to provide updates to any analysis contained herein. A complete list of investment recommendations made during the past year is available upon request. Past performance is not an indication of future returns. This information is distributed to recipients including AAM, any of which may have acted on the basis of the information, or may have an ownership interest in securities to which the information relates. It may also be distributed to clients of AAM, as well as to other recipients with whom no such client relationship exists. Providing this information does not, in and of itself, constitute a recommendation by AAM, nor does it imply that the purchase or sale of any security is suitable for the recipient. Investing in the bond market is subject to certain risks including market, interest-rate, issuer, credit, inflation, liquidity, valuation, volatility, prepayment and extension. No part of this material may be reproduced in any form, or referred to in any other publication, without express written permission.