insight
AAM Corporate Credit View: 2Q2013
July 11, 2013
Second Quarter 2013
- Spread Widening in June Wipes Out Performance for the First Five Months
- Market Technicals are Supportive in the Near Term
- Credit Fundamentals are Moderating and Rating Downgrades are Increasing
- Increased Share Repurchase and Merger & Acquisition Activity is Expected
- AAM Expects Spread Tightening in the Second Half of 2013
Investment Grade Corporate Bond Spreads Widened in June
Investment grade corporate spreads tightened from 141 basis points (bps) at year-end 2012 to 130 bps in mid-May, as investors sought additional yield versus Treasuries after Treasury rates fell on the premise of a sluggish domestic economy and QE3 extending in 2014 (Exhibit 1). Concurrently, the European Central Bank indicated a willingness to become more accommodative and the Central Bank of Japan deployed a massive monetary stimulus. That technical support changed when the Federal Open Market Committee (FOMC) minutes were released in late May and the Fed Chairman spoke in June, stating “that if the Fed’s updated economic forecasts out today are correct, the FOMC may moderate purchases later in 2013 and end them around mid-2014 if the economic data warrants it.” As Treasury yields increased approximately 100 bps from their low points in May, spreads widened 20 bps, a relationship that has historically been negatively correlated. The volatility in the Treasury market increased the volatility in many other markets around the world (equities, currencies, commodities, and fixed income), resetting prices and resulting in negative total returns. Emerging markets have been hit especially hard, as liquidity is withdrawn and China’s growth expectations are reset lower.
Exhibit 1
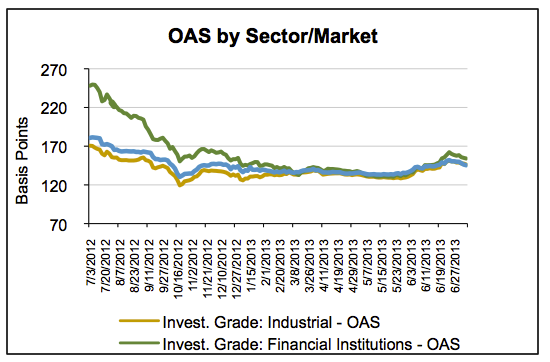
Source: Barclays Capital, AAM
Exhibit 2
| Excess Returns YTD (bps) | Total | BBB | A |
| Industrials | -70 | -50 | -99 |
| Utilities | 13 | 25 | -5 |
| Finance | 35 | 123 | 1 |
| Corp Index | -27 | -3 | -46 |
The Investment Grade Corporate market underperformed Treasuries in the first half of 2013 per Barclays by 0.27% because of the performance in June (-1.18% bps excess return). The Finance sector has outperformed this year along with BBB rated non-Industrials (Exhibit 2). Investors have looked to Finance and Utilities versus the more event risk prone Industrial sectors. Industrial bonds with long maturities have performed particularly poorly (-1.58% YTD 6/30), as investors recognize the lack of spread protection in the face of increased volatility. Since June 25, the increased yields have enticed buyers on the long end, driving performance (20 bps tighter versus 11 bps tighter for Barclays Corporate Index) especially for high quality issuers.
Technicals are Supportive for Spreads in the Near Term
Technical pressure was a cause of the widening in Corporate bonds, as Exchange Traded Funds (ETF) and mutual funds experienced outflows ($1.5 billion, $871 million, respectively), at a level last seen in October 2011 when European concerns were pulling down the markets. Broker dealer inventories of corporate bonds had increased in May and market volatility was increasing, leaving them unable to absorb the redemptions and resulting in wider spreads. These wider spreads did ultimately entice buyers as evidenced by the net buying of $5 billion in the secondary market during June. New issue volume was very low ($35 billion), but for the new issues that came to market, deals were oversubscribed and attractively priced. We believe the net selling by broker dealers in June leave inventories very light. With supply expected to be seasonally low in July and August and coupon income of $57 billion/month, spreads are poised to tighten even if modest outflows continue.
Credit Fundamentals are Moderating Mid-Point in the Cycle
We monitor the performance of over 500 global investment grade industrial and utility companies. Our analysis points to credit fundamentals that are at the mid-point in the cycle. Starting with the balance sheet, one can see that leverage is rising (Exhibit 3) for Industrials and Utilities. The drop in commodity prices has caused leverage to increase for commodity based firms due to falling cash flows as well as increased debt. From a gross debt perspective, companies have moderate capacity to increase leverage without affecting their debt ratings. However, cash balances remain very high (Exhibit 4). Despite a significant percentage being held overseas, this cash gives firms financial flexibility to weather periods of uncertainty, make acquisitions, or buyback stock. We believe this is also a good indicator of how management teams feel about the economy and market opportunities.
Exhibit 3
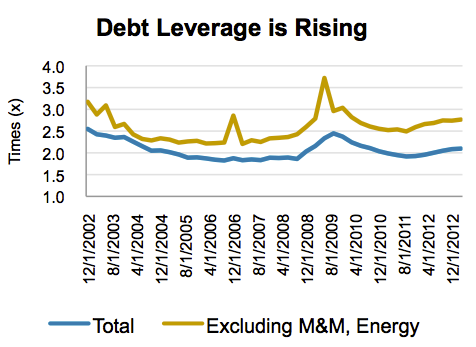
Exhibit 4
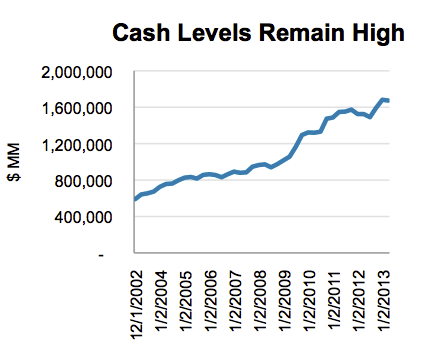
Source: AAM, Capital IQ (Universe includes 546 Utility and Industrial companies)
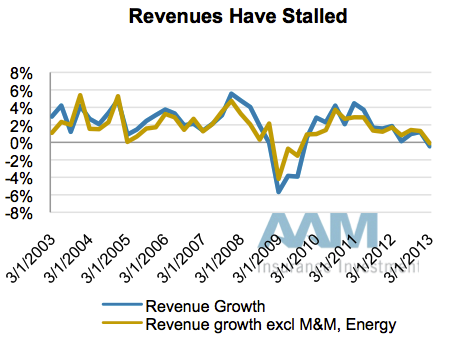
Operating margins have deteriorated for the commodity companies and have stalled for others (Exhibit 5). This is due to a reduction in revenue growth, as global economic growth cools (Exhibit 6). Note the same trend emerged in late 2004 before growth was reignited by leverage from the housing sector. Therefore, management teams are still very concerned about growth. This appears to be the case for small businesses as well. In the latest National Federation of Independent Business (NFIB) small business survey, more firms reported sales declining and the net percentage of owners expecting higher real sales volume fell three percentage points to 5% of all owners. Moreover, government related issues (taxes, regulation, and insurance) and poor sales were reported as the single most important small business problem for 67% of firms. All of these issues have an impact on net income. This is likely the reason that only net 7% of NFIB participating firms were planning to hire in June.
Exhibit 5
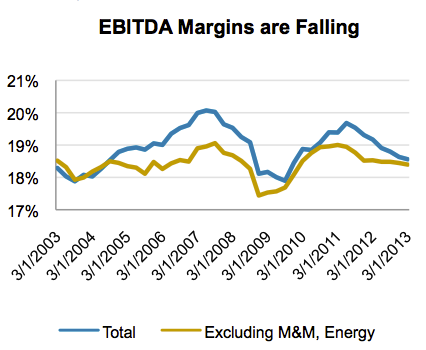
Exhibit 6
Source: AAM, Capital IQ (Universe includes 546 Utility and Industrial companies)
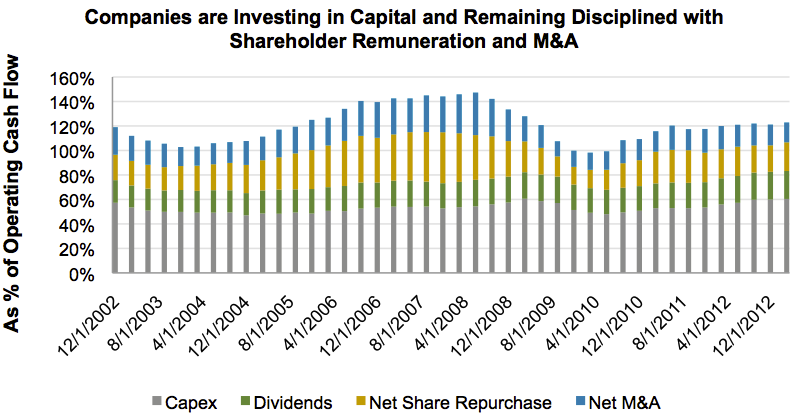
How have companies invested their operating cash? Exhibit 7 deconstructs the main uses of operating cash flow: capital spending, dividends, share repurchases net issuance, and mergers and acquisitions (M&A) net asset sales. Capital spending is up from about 50% to 60%, a level usually experienced in a recession as operating cash flow declines. We believe companies have spent more on capital during this economic cycle due to unique incentives, namely lower interest rates and tax breaks. As an aside, the accelerated depreciation allowance expires this year, which will cause cash taxes to increase and free cash flow to fall. Dividends are fairly even at about 20%. The last two are worth noting. Share buybacks are in line with levels midway through an economic cycle. As an aside, this percentage increased after 2004, as margins stalled and leverage started to increase. Similarly, M&A activity has been fairly modest despite the low interest and growth rates. We believe this has a lot to do with the volatility in the markets and the uncertainties that exist from a government and regulatory standpoint that makes forecasting return on investment difficult.
Exhibit 7
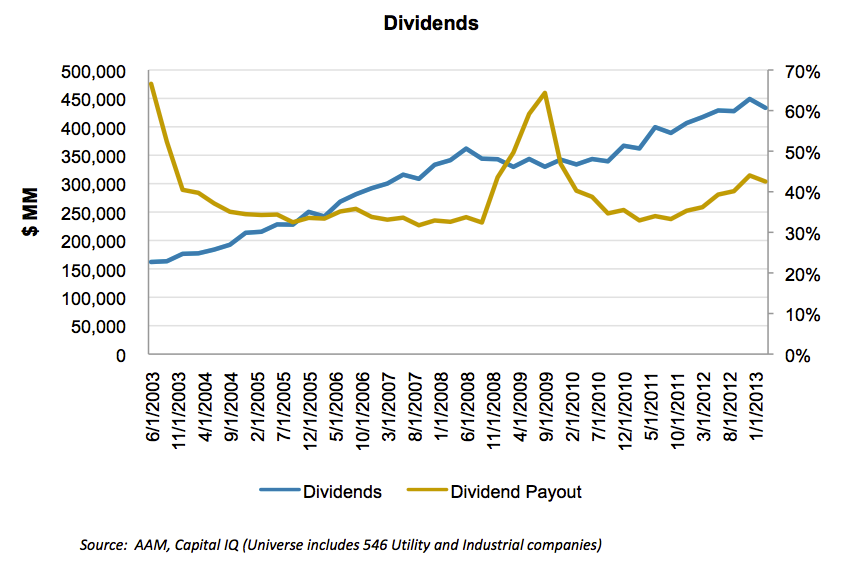
What do we expect over the next 12 months? We are not expecting a material increase in the rate of dividends despite a clamoring for income. The rate has increased and is now approaching levels typically seen around a recession, as net income falls (Exhibit 8).
Exhibit 8
We do believe companies will increase stock repurchase and M&A activity (Exhibits 9 and 10). Although interest rates have increased, they remain low in historic terms. We expect cash and debt to be used to fund this activity, especially for firms that have benefitted the most from accelerated depreciation. We continue to largely avoid the sectors and credits that are vulnerable to this activity, namely those that are growth challenged and under leveraged (i.e., Telecommunications, Aerospace Defense, Consumer Products, and Technology).
Exhibit 9
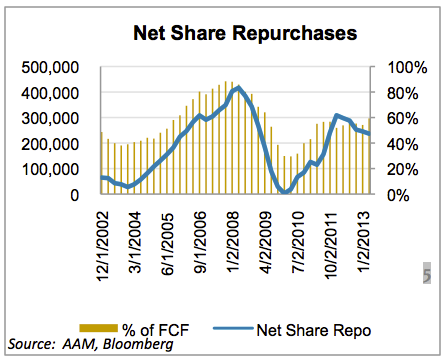
Exhibit 10
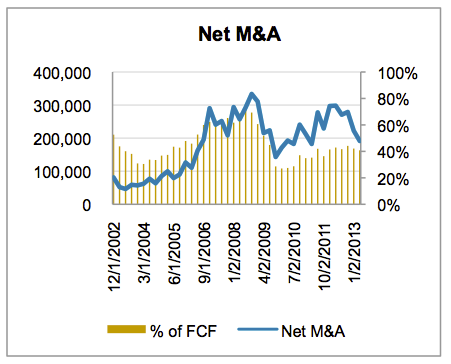
Exhibit 11
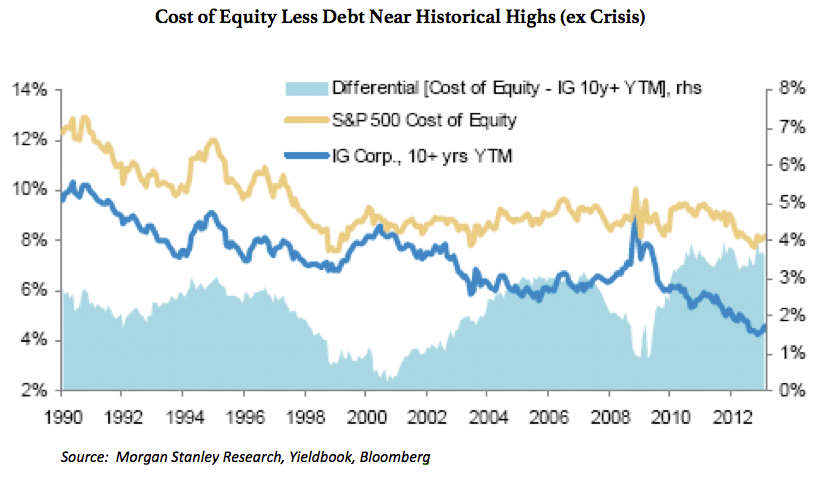
Exhibit 12
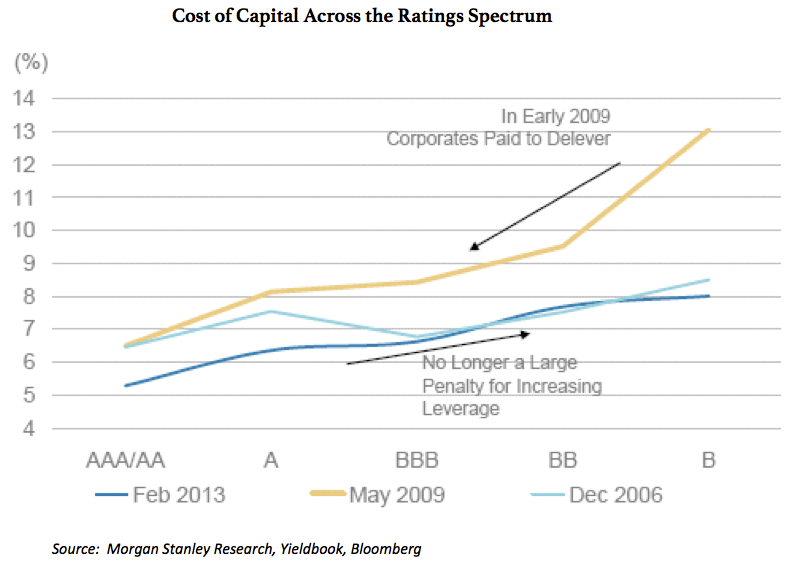
With the gap between the cost of equity versus the cost of debt historically high, management teams are incentivized to use their balance sheets to fund growth. Also, the weighted average cost of capital (WACC) curve is historically flat in investment grade (Exhibit 11 and 12), resulting in a small cost for sliding down the ratings scale.
That trend has started. The ratio of upgrades to downgrades fell at Moody’s to 0.89 times in the first five months of 2013, which is the lowest since the first five months in 2009. It peaked at 1.55 times in 2010[note]Matt Robinson, “Ratings Ratio Worst Since 2009 as Profits Slow” Bloomberg, June 26, 2013, accessed June 28, 2013, http://www.bloomberg.com/news/2013-06-26/ratings-ratio-worst-since-2009-as-profits-slow-credit-markets.html[/note]. In general, we continue to prefer BBB versus A rated securities, as investors are not getting paid for this downgrade risk. The gap is between BBB and A rated Industrials is attractive at over 80 bps versus our target of 50 bps (prior cycle minimum was 27 bps). We continue to believe security selection will become a more important driver of returns, as we move into the second half of the credit cycle.
AAM Expects Performance from Corporate Bonds in the Second Half
We had expected spreads to remain fairly stable in the second quarter with economic activity expected to be largely the same as the first quarter and then slowly picking up over the second half. Although GDP growth for the second quarter is expected to be only 1.6% versus the 1.8% in the first quarter (Bloomberg economic consensus), the Fed changed the technical dynamics with the talk of tapering, causing spreads to widen in June. We have been skeptical of the Fed’s ability to withdraw stimulus given the muted growth of the business sector, making it difficult to support a meaningful decline in the unemployment rate. That said, with payrolls growing at a rate of 150,000 to 200,000, the market’s expectation is for the Fed to taper later this year, possibly in September.
Spreads have been tightening since June 25 with the relative stabilization in rates. In our view, the two likely paths are constructive for corporate credit: (1) The Fed is right and economic growth accelerates which is positive for Corporate fundamentals, namely revenue growth or (2) The Fed is wrong and growth remains subdued causing the Fed to remain accommodative and demand for Corporate bonds to continue as a yield alternative to Treasuries. Therefore, we remain constructive on overall corporate credit.
Written by:
Elizabeth Henderson, CFA
Director of Corporate Credit
Disclaimer: Asset Allocation & Management Company, LLC (AAM) is an investment adviser registered with the Securities and Exchange Commission, specializing in fixed-income asset management services for insurance companies. This information was developed using publicly available information, internally developed data and outside sources believed to be reliable. While all reasonable care has been taken to ensure that the facts stated and the opinions given are accurate, complete and reasonable, liability is expressly disclaimed by AAM and any affiliates (collectively known as “AAM”), and their representative officers and employees. This report has been prepared for informational purposes only and does not purport to represent a complete analysis of any security, company or industry discussed. Any opinions and/or recommendations expressed are subject to change without notice and should be considered only as part of a diversified portfolio. A complete list of investment recommendations made during the past year is available upon request. Past performance is not an indication of future returns.
This information is distributed to recipients including AAM, any of which may have acted on the basis of the information, or may have an ownership interest in securities to which the information relates. It may also be distributed to clients of AAM, as well as to other recipients with whom no such client relationship exists. Providing this information does not, in and of itself, constitute a recommendation by AAM, nor does it imply that the purchase or sale of any security is suitable for the recipient. Investing in the bond market is subject to certain risks including market, interest-rate, issuer, credit, inflation, liquidity, valuation, volatility, prepayment and extension. No part of this material may be reproduced in any form, or referred to in any other publication, without express written permission.
Disclaimer: Asset Allocation & Management Company, LLC (AAM) is an investment adviser registered with the Securities and Exchange Commission, specializing in fixed-income asset management services for insurance companies. Registration does not imply a certain level of skill or training. This information was developed using publicly available information, internally developed data and outside sources believed to be reliable. While all reasonable care has been taken to ensure that the facts stated and the opinions given are accurate, complete and reasonable, liability is expressly disclaimed by AAM and any affiliates (collectively known as “AAM”), and their representative officers and employees. This report has been prepared for informational purposes only and does not purport to represent a complete analysis of any security, company or industry discussed. Any opinions and/or recommendations expressed are subject to change without notice and should be considered only as part of a diversified portfolio. Any opinions and statements contained herein of financial market trends based on market conditions constitute our judgment. This material may contain projections or other forward-looking statements regarding future events, targets or expectations, and is only current as of the date indicated. There is no assurance that such events or targets will be achieved, and may be significantly different than that discussed here. The information presented, including any statements concerning financial market trends, is based on current market conditions, which will fluctuate and may be superseded by subsequent market events or for other reasons. Although the assumptions underlying the forward-looking statements that may be contained herein are believed to be reasonable they can be affected by inaccurate assumptions or by known or unknown risks and uncertainties. AAM assumes no duty to provide updates to any analysis contained herein. A complete list of investment recommendations made during the past year is available upon request. Past performance is not an indication of future returns. This information is distributed to recipients including AAM, any of which may have acted on the basis of the information, or may have an ownership interest in securities to which the information relates. It may also be distributed to clients of AAM, as well as to other recipients with whom no such client relationship exists. Providing this information does not, in and of itself, constitute a recommendation by AAM, nor does it imply that the purchase or sale of any security is suitable for the recipient. Investing in the bond market is subject to certain risks including market, interest-rate, issuer, credit, inflation, liquidity, valuation, volatility, prepayment and extension. No part of this material may be reproduced in any form, or referred to in any other publication, without express written permission.