insight
AAM Corporate Credit View: 3Q2013
October 17, 2013
Investment Grade Bond Market Performance Summary
In the third quarter of 2013, investment grade corporate bond spreads staged a nice comeback with significant tightening starting at the beginning of July. This performance was caused by the stability in interest rates and slower outflows from bond mutual funds, the result of dovish comments out of the Federal Reserve and in-line economic data. The OAS of the corporate market was 141 at the end of September, which was unchanged compared to the beginning of this year. Since mid-July, spreads have remained fairly stable as we have successfully moved through a host of key market risks, including the prospect of military action in Syria, FOMC (Federal Open Market Committee) action regarding QE tapering, and emerging market growth concerns. Most recently, all eyes have been on the dysfunctional political system in Washington DC, specifically the government shut down and the lack of a resolution regarding the debt ceiling. In typical fashion, a temporary solution was reached on these issues. We expect these same issues to creep up again next year as lawmakers simply pushed back the deadlines. Healthy corporate balance sheets along with a stable, albeit low rate of top line growth against a strong technical backdrop should allow for moderate spread tightening for the rest of the year. We believe the recent situation in Washington will, in effect, reduce the chances of tapering this year as positive economic data points are lacking and the impact of the government shutdown on consumer and business spending remains even more clouded. Therefore, our base case scenario is that rates will remain in a range which should keep corporate bond investors placated.
Investment Grade Fundamental Review- Steady as She Goes
As we enter into the third quarter of 2013 earnings season, we believe investors will refocus on corporate fundamentals. While we are clearly off the peak established in 2010, corporate balance sheets and cash flow remain healthy. Exhibit 1 looks at the fundamentals of over 400 industrial, investment grade companies. For the past four quarters, free cash flow, share repurchase activity, and leverage (debt/EBITDA) are unchanged. Corporations are in a holding pattern with spending/leverage until they have more conviction of top line growth. We expect EBITDA to grow in the mid-to-low single digits in 2013, with similar growth in 2014. This should help improve leverage slightly, as we don’t expect companies to focus on outright debt reduction in the near term. Also, we would expect free cash flow to improve, which likely results in more aggressive share repurchase activity. Cash and short term investments as a percentage of total debt was 35% at the end of the second quarter in 2013. This has been a very stable metric, ranging between 32% and 37% since the fourth quarter of 2009. In addition, we may see some upside to earnings for those companies that are exposed to Europe, as that region begins to show positive growth.
Exhibit 1: Consolidated Financials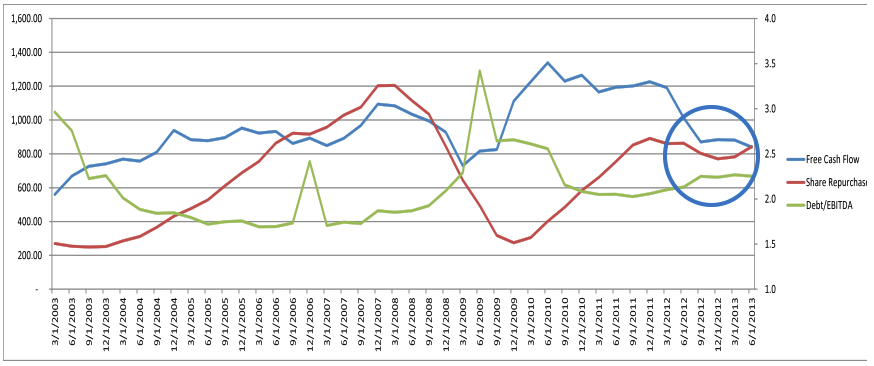
Source: CapitalIQ
Corporate Bond Market Technical Analysis – Set Up Nicely for the Rest of 2013
Gross new issuance in the third quarter of 2013 was $244 billion, an 8% increase over the second quarter of 2013. However, the current quarter included the massive $49 billion deal from Verizon. Without Verizon, the third quarter total would be $195 billion or a 13% decrease from the second quarter. A decrease in issuance is not unexpected since the summer months of July and August are typically quiet. However, with concerns regarding an approaching Fed taper, and commensurate higher interest rates, issuers were more active this September with $136 billion in gross issuance, including the Verizon deal. The YTD total for gross issuance stands at $717 billion versus an estimate for 2013 of $850 billion. We believe issuance will slow in the fourth quarter of 2013 to a more typical level of approximately $165 billion, pushing issuance for 2013 to $880 billion.
The active issuance in September resulted in wider new issue concessions. The average deal concession for September was 9 basis points (bps), which was up from the August average of 7 bps. However, the last few days of September saw concessions average approximately 11 bps. The last time concessions were at these levels was the first week of July, which hit the peak for 2013 of 24 bps.
Upon further review of new issue in 2013, we notice an interesting difference in tenor. Year-to-date, 19% of all investment grade corporate deals have been 30-year maturities. This is higher than the 16% in 2012 and the 2009 – 2012 average of 15%. Despite greater long end supply, the 10-to-30 year spread curve has flattened approximately 10 to 12 bps since the start of the year as shown in Exhibit 2. Issuers have been more than happy to satisfy the demand for higher yields from insurance companies and pension funds, which has increased as interest rates experience less volatility while inching higher.
Secondary volumes have also been robust this year. Year-to-date, customers have bought and sold $1.8 trillion of investment grade corporate bonds, a 13% increase from the same year-to-date period in 2012. So far in 2013, investors have been net buyers of corporates to the tune of $15 billion. At this point last year, investors had net purchased $9 billion. However, investors net sold $6 billion in September which was most likely used to pay for the heavy new issue calendar. Investor appetite for long end paper can also be seen in the secondary volumes. Meanwhile, two and three year maturities saw heavy demand in the third quarter of 2013, but most of the demand occurred during July and August, as investors parked cash anticipating heavy new issuance in September. While investors were net sellers of corporates in September across all maturities, the demand for the long end materialized once again during the first two weeks of October. Also, we also expect demand for 10-year maturities to increase as 5 to 10-year spread curves are historically steep as illustrated in Exhibit 2.
Exhibit 2
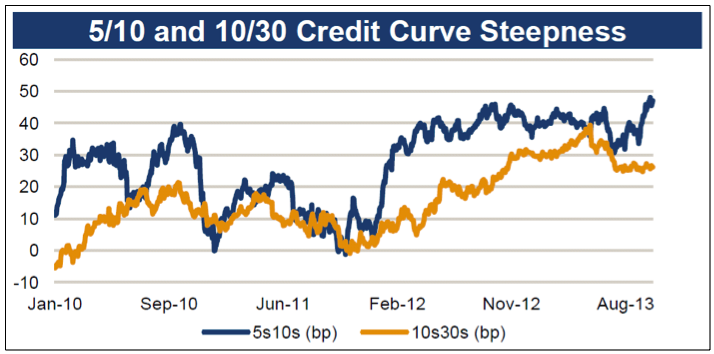
Source: Barclays
Written by:
Michael Ashley
Senior Research Analyst
Corporate Credit
Disclaimer: Asset Allocation & Management Company, LLC (AAM) is an investment adviser registered with the Securities and Exchange Commission, specializing in fixed-income asset management services for insurance companies. This information was developed using publicly available information, internally developed data and outside sources believed to be reliable. While all reasonable care has been taken to ensure that the facts stated and the opinions given are accurate, complete and reasonable, liability is expressly disclaimed by AAM and any affiliates (collectively known as “AAM”), and their representative officers and employees. This report has been prepared for informational purposes only and does not purport to represent a complete analysis of any security, company or industry discussed. Any opinions and/or recommendations expressed are subject to change without notice and should be considered only as part of a diversified portfolio. A complete list of investment recommendations made during the past year is available upon request. Past performance is not an indication of future returns.
This information is distributed to recipients including AAM, any of which may have acted on the basis of the information, or may have an ownership interest in securities to which the information relates. It may also be distributed to clients of AAM, as well as to other recipients with whom no such client relationship exists. Providing this information does not, in and of itself, constitute a recommendation by AAM, nor does it imply that the purchase or sale of any security is suitable for the recipient. Investing in the bond market is subject to certain risks including market, interest-rate, issuer, credit, inflation, liquidity, valuation, volatility, prepayment and extension. No part of this material may be reproduced in any form, or referred to in any other publication, without express written permission.
Disclaimer: Asset Allocation & Management Company, LLC (AAM) is an investment adviser registered with the Securities and Exchange Commission, specializing in fixed-income asset management services for insurance companies. Registration does not imply a certain level of skill or training. This information was developed using publicly available information, internally developed data and outside sources believed to be reliable. While all reasonable care has been taken to ensure that the facts stated and the opinions given are accurate, complete and reasonable, liability is expressly disclaimed by AAM and any affiliates (collectively known as “AAM”), and their representative officers and employees. This report has been prepared for informational purposes only and does not purport to represent a complete analysis of any security, company or industry discussed. Any opinions and/or recommendations expressed are subject to change without notice and should be considered only as part of a diversified portfolio. Any opinions and statements contained herein of financial market trends based on market conditions constitute our judgment. This material may contain projections or other forward-looking statements regarding future events, targets or expectations, and is only current as of the date indicated. There is no assurance that such events or targets will be achieved, and may be significantly different than that discussed here. The information presented, including any statements concerning financial market trends, is based on current market conditions, which will fluctuate and may be superseded by subsequent market events or for other reasons. Although the assumptions underlying the forward-looking statements that may be contained herein are believed to be reasonable they can be affected by inaccurate assumptions or by known or unknown risks and uncertainties. AAM assumes no duty to provide updates to any analysis contained herein. A complete list of investment recommendations made during the past year is available upon request. Past performance is not an indication of future returns. This information is distributed to recipients including AAM, any of which may have acted on the basis of the information, or may have an ownership interest in securities to which the information relates. It may also be distributed to clients of AAM, as well as to other recipients with whom no such client relationship exists. Providing this information does not, in and of itself, constitute a recommendation by AAM, nor does it imply that the purchase or sale of any security is suitable for the recipient. Investing in the bond market is subject to certain risks including market, interest-rate, issuer, credit, inflation, liquidity, valuation, volatility, prepayment and extension. No part of this material may be reproduced in any form, or referred to in any other publication, without express written permission.