insight
AAM Corporate Credit View: January 2011
January 10, 2011
2010 in Review
The Corporate market as represented by Barclays Capital Corporate Index posted positive excess returns of 229 basis points (bps). While it pales in comparison to the 2,276 bps of excess return earned last year, it is higher than the 10-year average of 78 bps. The excess return was driven more from the carry associated with the wider than average spread and less from spread tightening (14 bps).
The Finance sector outperformed strongly with 326 bps of excess returns versus 175 bps for Industrials and 181 bps for Utilities. Finance spreads compressed versus Industrials and Utilities, sectors that outperformed last year. The 5 to 7 year part of the Corporate maturity curve outperformed (+343 bps excess returns) and 10+ year underperformed (+1.76 bps). From a total return perspective, the long end outperformed as Treasury yields fell (Exhibit 1) and spreads only widened 1 basis point (Exhibit 2). In summary, performance largely came from A and BBB rated Financial issuers, BBB rated Industrial issuers and/or bonds in the middle of the curve (5 to 10 year maturities). That said, it was a good year overall as the vast majority of Corporate sectors posted positive excess returns.
Exhibit 1: Change in Treasury Yields in 2010
| Yields | 1/4/10 | 12/31/10 | Change |
| 1 year | 0.400% | 0.262% | (0.138%) |
| 2 year | 1.064% | 0.593% | (0.471%) |
| 3 year | 1.611% | 0.987% | (0.624%) |
| 5 year | 2.635% | 2.006% | (0.629%) |
| 7 year | 3.349% | 2.701% | (0.648%) |
| 10 year | 3.815% | 3.294% | (0.521%) |
| 30 year | 4.643% | 4.334% | (0.30%) |
Source: Bloomberg
Exhibit 2: Change in Spreads in 2010 (basis points)
| Finance spreads outperformed, compressing with Industrial and Utility spreads | ||||
| AAA | AA | A | BBB | |
| Industrial | (8) | 1 | (1) | (2) |
| Utility | NA | (7) | (9) | (14) |
| Finance | (28) | (5) | (23) | (116) |
| Long end spreads underperformed | ||||
| 1-3 year | (56) | |||
| 3-5 year | (4) | |||
| 5-7 year | – | |||
| 7-10 year | (15) | |||
| 10+ year | 1 | |||
Source: Barclays Capital
Going into the second quarter, spreads widened mid-year after the U.S. economy’s recovery was questioned. The stock market dropped on European concerns, consumer and business confidence waned and economic data releases were weaker than expected. The spread rally began in August after the Fed reiterated its support, which would later become “QE2” (Exhibit 3).
Exhibit 3: Barclays Corporate Index Option Adjusted Spread (OAS)
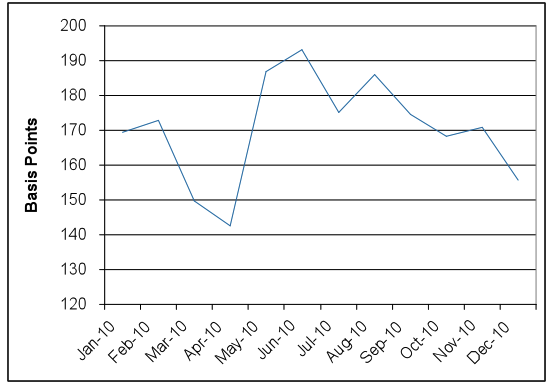
Source: Barclays Capital
2010 was a year that was largely in line with our expectations. Specifically, the Corporate bond market posted positive excess returns, and economic growth was weaker than economists were forecasting earlier in the year. The economic and political uncertainties caused companies to be defensive, hoarding cash in lieu of expansion and/or distributions to shareholders. Profits for investment grade companies were better than expected, as revenues grew, costs remained highly scrutinized and productivity increased. Companies invested in technology and took advantage of lower interest rates to refinance debt. Excluding Energy, cyclical sectors outperformed the more defensive Industrial and Utility sectors due to their wider spreads entering 2010, reflecting the economic uncertainty especially relating to the consumer (Exhibit 4).
Exhibit 4: Sub-Sector Performance in 2010
| Defensive Sectors | Excess Returns |
| Food/Beverage | 211 |
| Pharmaceuticals | 170 |
| Railroads | 168 |
| Diversified Manufacturing | 167 |
| Electric Utilities | 165 |
| Aerospace/Defense | 100 |
| Supermarkets | 71 |
| Cyclical Sectors | |
| Tobacco | 456 |
| Automotive | 434 |
| Metals & Mining | 333 |
| Media – Entertainment | 258 |
| Chemicals | 239 |
| Retailers | 141 |
| Energy | 85 |
Source: Barclays Capital
Most banks returned to profitability as a result of improving asset quality and falling credit costs. However, top-line revenues were challenged by weak loan growth, low interest rates, subdued capital markets activity levels and restrictions on fees for overdraft and interchange imposed by the Dodd-Frank Act. Our view of this sector as providing a source of outperformance due to wide spreads and improving fundamentals was borne out over the course of the year. However, the combination of macroeconomic uncertainty and continued headline/event risk (e.g., SEC inquiries/mortgage-related litigation/regulatory risks) made this one of the more volatile sectors, despite its outperformance over the course of the year.
The European contagion that many feared late in the spring of 2010 is a risk that remains unresolved. While U.S. investors tend to underestimate the political will power of Europe’s elected leaders to sustain the European Union (EU) and the common currency, the underlying structural deficiency of a common currency without an integrated fiscal policy must ultimately be addressed. Until it becomes clearer whether the EU’s structural issue will be addressed in an organized or disorganized manner, bank, utility and telecommunication credit spreads will remain wide for those issuers domiciled in the peripheral countries (most notably Spain, Italy, Portugal, Greece and Ireland).
In terms of idiosyncratic events, the most significant was the Macondo oil spill in the Gulf of Mexico. The most liquid ten-year bond from British Petroleum (BP) was quoted at a spread to Treasury of 25 bps pre-Macondo spill and widened to 450 bps in late June 2010 when rumors of a BP bankruptcy surfaced. However, those bonds have recovered the majority of the spread widening (now 75 bps over the Treasury) as BP has established the liquidity necessary to meet any cash calls in the near term.
Bonds issued by other involved parties witnessed similar volatility. The most liquid ten-year bond from Anadarko, a partner with BP in the Macondo well, was quoted at a spread to Treasury of 110 bps pre-Macondo spill and widened to 570 bps in late June 2010, when it was downgraded to Ba1 by Moody’s. Recent rumors of a possible acquisition of Anadarko have helped this bond recover to 170 bps over the Treasury. The most liquid ten-year bond from Transocean, the contract driller at the Macondo well, was quoted at a spread to Treasury of 62 bps pre-spill and widened to 500 bps over the Treasury in mid-June. The bond is now quoted at 153 bps over the Treasury as the market is comfortable that the contract driller will be able to meet any penalties or negotiated settlements and maintain solvency.
From a technical perspective, demand remained high for Corporates despite dealers reducing their inventories of Corporate bonds (Exhibit 5). Mutual fund inflows into high grade Corporates remained very strong in 2010, increasing 16.7% per AMG Data Services, as investors rotated out of money markets and into riskier asset classes once again. U.S. life insurance companies increased their holdings of corporate bonds as of September 30, 2010[1], owning more than $2 trillion for the first time.
A number of factors have conspired to constrain dealer inventories over the past several years. Most notable has been the dwindling field of dealers with balance sheet capacity (e.g., Bear Stearns, Lehman Brothers, Merrill Lynch). While numerous boutiques have sprung up in their wake, these start-ups have limited capital and balance sheet capacity. At the same time, the remaining large dealers were made painfully aware of their over-reliance on wholesale funding to finance large inventories in the run-up to 2008. Subsequently, dealers have been engaged in a multi-year de-leveraging process which has reduced average gross leverage from a high of well over 30 times (x) to around 20x today. Lastly, the pending debut of the Basel III capital regime beginning in 2013 will put pressure on dealers to run lower inventory in a number of ways. First, the market risk associated with inventories will be more heavily weighted in capital calculations. Additionally, Basel III moves away from a purely ratings based risk weighting, resulting in higher capital charges for a range of structured products (e.g., Residential Mortgage Backed Securities(RMBS), Commercial Mortgage Backed Securities(CMBS), Collateralized Loan Obligations(CLO)). Finally, European banks will be subject to a 3% minimum gross leverage ratio, which will meaningfully constrain the ability to grow their balance sheets (U.S. banks are already subject to a minimum leverage ratio).
On the supply side, gross new issuance for 2010 was $659 billion, which was nearly unchanged versus 2009 and about 32% higher than estimates. Issuers took advantage of attractive rates to refinance future maturities as well as investors’ continued appetite for Corporate credit. While gross issuance was unchanged, net new issuance, which includes maturities and redemptions, was down 15% to $422 billion. With respect to sectors, Financial issuance led the charge up 52% ($313 billion) versus 2009. However, Industrial issuance was down 23% ($295 billion) and Utility down 27% ($50 billion).
Exhibit 5
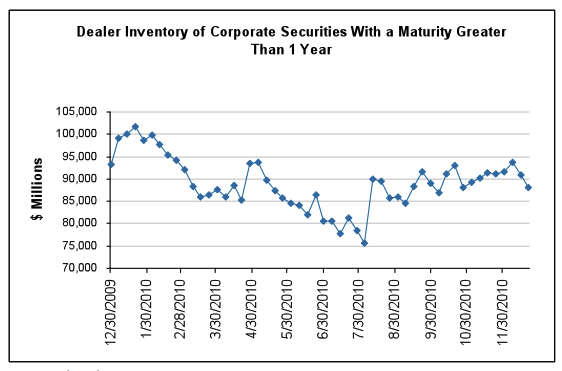
Source: Bloomberg
In summary, despite the economic uncertainty, regulatory and political issues around the world, and Macondo spill, 2010 was fairly benign for the Corporate market. The standard deviation of the OAS last year was 13 bps versus a mean of 170 bps for the Barclays Capital Corporate Index. This compares to a 10-year history of 110 bps and 174 bps respectively. Even the 10-year period from 1997-2007, which excludes the financial crisis, was more volatile at 45 bps versus a mean of 129 bps. So, what do we expect for 2011? We will answer that next month.
Disclaimer: Asset Allocation & Management Company, LLC (AAM) is an investment adviser registered with the Securities and Exchange Commission, specializing in fixed-income asset management services for insurance companies. This information was developed using publicly available information, internally developed data and outside sources believed to be reliable. While all reasonable care has been taken to ensure that the facts stated and the opinions given are accurate, complete and reasonable, liability is expressly disclaimed by AAM and any affiliates (collectively known as “AAM”), and their representative officers and employees. This report has been prepared for informational purposes only and does not purport to represent a complete analysis of any security, company or industry discussed. Any opinions and/or recommendations expressed are subject to change without notice and should be considered only as part of a diversified portfolio. A complete list of investment recommendations made during the past year is available upon request. Past performance is not an indication of future returns.
This information is distributed to recipients including AAM, any of which may have acted on the basis of the information, or may have an ownership interest in securities to which the information relates. It may also be distributed to clients of AAM, as well as to other recipients with whom no such client relationship exists. Providing this information does not, in and of itself, constitute a recommendation by AAM, nor does it imply that the purchase or sale of any security is suitable for the recipient. Investing in the bond market is subject to certain risks including market, interest-rate, issuer, credit, inflation, liquidity, valuation, volatility, prepayment and extension. No part of this material may be reproduced in any form, or referred to in any other publication, without express written permission.
[1] Federal Reserve
Disclaimer: Asset Allocation & Management Company, LLC (AAM) is an investment adviser registered with the Securities and Exchange Commission, specializing in fixed-income asset management services for insurance companies. Registration does not imply a certain level of skill or training. This information was developed using publicly available information, internally developed data and outside sources believed to be reliable. While all reasonable care has been taken to ensure that the facts stated and the opinions given are accurate, complete and reasonable, liability is expressly disclaimed by AAM and any affiliates (collectively known as “AAM”), and their representative officers and employees. This report has been prepared for informational purposes only and does not purport to represent a complete analysis of any security, company or industry discussed. Any opinions and/or recommendations expressed are subject to change without notice and should be considered only as part of a diversified portfolio. Any opinions and statements contained herein of financial market trends based on market conditions constitute our judgment. This material may contain projections or other forward-looking statements regarding future events, targets or expectations, and is only current as of the date indicated. There is no assurance that such events or targets will be achieved, and may be significantly different than that discussed here. The information presented, including any statements concerning financial market trends, is based on current market conditions, which will fluctuate and may be superseded by subsequent market events or for other reasons. Although the assumptions underlying the forward-looking statements that may be contained herein are believed to be reasonable they can be affected by inaccurate assumptions or by known or unknown risks and uncertainties. AAM assumes no duty to provide updates to any analysis contained herein. A complete list of investment recommendations made during the past year is available upon request. Past performance is not an indication of future returns. This information is distributed to recipients including AAM, any of which may have acted on the basis of the information, or may have an ownership interest in securities to which the information relates. It may also be distributed to clients of AAM, as well as to other recipients with whom no such client relationship exists. Providing this information does not, in and of itself, constitute a recommendation by AAM, nor does it imply that the purchase or sale of any security is suitable for the recipient. Investing in the bond market is subject to certain risks including market, interest-rate, issuer, credit, inflation, liquidity, valuation, volatility, prepayment and extension. No part of this material may be reproduced in any form, or referred to in any other publication, without express written permission.