insight
AAM Corporate Credit View: July 2011
July 18, 2011
Mid-Year Review and Outlook
Investment grade corporate bond spreads widened again last month, producing -35 basis points (bps) of excess return, as the OAS of the Barclays Corporate Index widened 7 bps. Performance year-to-date as of June 30 remained strongly positive (73 bps of excess return), albeit lower than the high of 152 bps on May 6. The Barclays High Yield Index widened 32 bps. For comparison, Barclays European Investment Grade Corporate Index widened 20 bps and the European High Yield Index widened 54 bps. This reflects the market’s primary concern, the potential for systemic risk emanating from Europe. Excluding credits that were involved in leveraging Mergers & Acquisitions (M&A), negative pre-announcements, ratings downgrades, etc., the credits that underperformed last month were largely European banks and telecommunication companies as well as domestic banks and insurance companies. The spread differential between Industrial BBB and A rated credits widened as well as the differential between Finance and Industrials (Exhibits 1A and 1B). Generally, the Finance, Energy, Utility and Satellite/Cable sectors have outperformed.
Exhibit 1A: Risk Premiums Revert to January Levels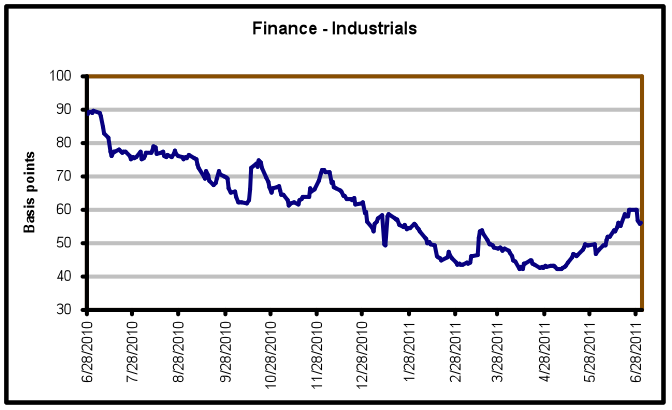 Source: Barclays, AAM
Exhibit 1B: Risk Premiums Revert to January Levels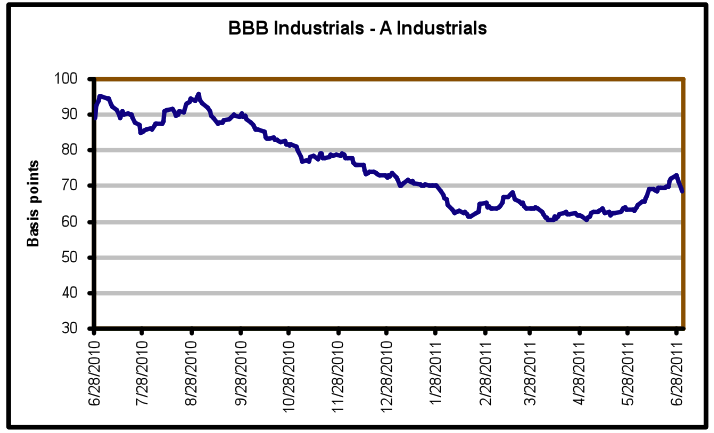 Source: Barclays, AAM
A reflection of the uncertainty and spread volatility, corporate bond new issue volume dropped significantly last month, to $30.4 billion gross or -$600 million net from $79.3 and $58.7 billion respectively in May. Commensurate with the decline in new issue volume, dealers were able to reduce inventories as investors sought purchases in the secondary market. For those deals that were issued, we saw strong demand. Therefore, buyers are present but more selective.
Entering 2011, we expected compression between BBB and A rated credits and Finance and commodity based sectors to outperform, leading to positive excess returns for Corporate bonds relative to Treasuries. Our main concerns were: higher input costs, sovereign related risks, increased event risk, and weaker than expected economic growth. Over the last two months, three of these risks have come to the fore, causing a re-pricing of risk assets. We have not changed our outlook, believing the US economy in the second half of 2011 will be more robust after auto production normalizes, and the downside stemming from a sovereign default in Europe will keep parties incentivized to work towards a managed solution. Moreover, our commodity price outlook remains consistent with GDP growth in the US of slightly less than 3%.
Industrials
We continue to expect commodity based sectors to outperform in the second half of the year, preferring Metals & Mining and Energy – Oil Field Service companies. We also see attractive risk-adjusted income opportunities in the Cable/Satellite sector. Conversely, we consider the following sectors as currently unattractive due to spreads that are not adequately reflecting various risks: Food/Beverage, Pharmaceuticals, Retail, Consumer Products, Paper, Technology and Media Noncable (namely newspapers and other “old line” media businesses). In greater detail:
Metals & Mining
Commodity prices have been volatile this year, mainly trending meaningfully upward, and China’s growth and demand remain a key factor. The Japanese natural disaster disrupted the market, impacting both coal and steel. We expect prices to remain strong and event risk to be high. That said, we believe the large, diversified metals companies have the financial flexibility to make acquisitions within their ratings profiles due to their very large cash coffers (50% Cash/Total Debt at 3/31/11 for the industry vs. a trough of 19% on 6/30/08). We remain skeptical of the pure play metals companies, as most gravitate towards low-triple-B and tend to focus on the very cyclical steel industry. We like the large, diversified mining companies that own long life assets and have ratings upgrade and spread tightening potential. Surprisingly, the industry has not ramped capital spending relative to revenues (11.7% at 3/31/11 vs. 11.2% at 3/31/07). We believe companies are more apt to increase their capital spending, but given the natural supply constraints, we are not worried about the magnitude relative to free cash flow generation.
Energy – Oil Field Services
A higher oil price and the expectation for an increase in exploration should lead to higher demand for oil field services. Going into 2011, management teams had used an oil price of $70-80/per barrel (bbl) to determine their capital spending plans. With oil currently slightly less than $100/bbl, we expect teams to revise their plans upward, which has positive ramifications for the drillers and service companies. Spreads have recovered from their peak after the Gulf spill, but continue to offer value versus other Energy and Industrial credits. As shown in Exhibits 2A and 2B, they offer considerable tightening potential relative to their levels prior to the financial crisis; a period of high oil prices. The main risks in this sector are higher capital spending without the corresponding increase in revenues due to economic contraction and/or leveraging M&A.
Exhibits 2A and 2B:
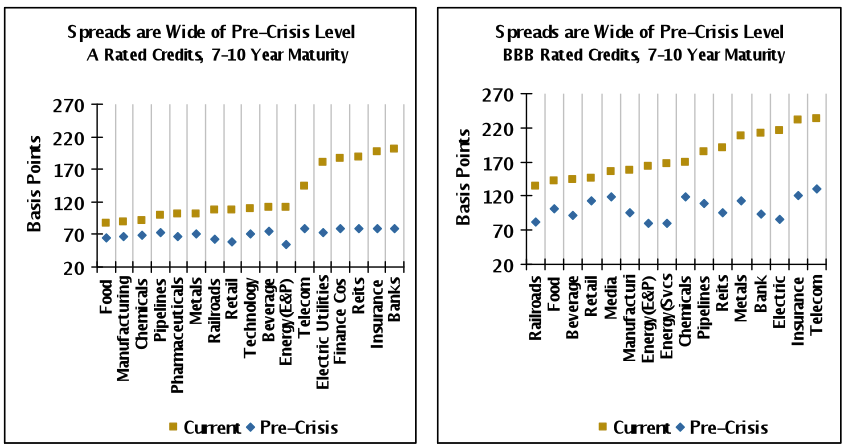
Source: Credit Suisse (LUCI Index; Current is 7/6/11; data since 1/1/05; benchmark spreads to curve), AAM
Note: Pre-Crisis is minimum spread prior to financial crisis as of 1/1/05
Media
We continue to remain comfortable with the fundamentals in the Cable/Satellite sector and with select companies in the Entertainment sector. The questions in 2010 about whether consumers would look to bypass their cable operators via Netflix and other similar services (“over-the-top”) have diminished as the cable companies innovate and media companies have re-priced content on these platforms. Consumers continue to prefer faster broadband speeds, giving the cable companies an edge versus the DSL providers. The Small and Mid-Sized Enterprises (SME) market should be a source of growth, mitigating the downside risks of lost revenues due to voice substitution(wireless, VoIP) and/or pricing pressure. Positively, these companies are largely domestic with no European exposure. That said, the housing market affects them and if it remains weak, will continue to pressure subscriber growth.
In the Entertainment sector, we prefer companies with original/produced content, a mix of mature and growing networks, domestic and international exposure, and strong brands. Cable and internet advertising continue to take share from the more traditional platforms (e.g., publishing, broadcast). In this more uncertain economy, we believe management teams may be more inclined to make investments with faster payback periods, which bodes well for advertising since it’s flexible and more predictable relative to investing in research and development, which provides returns over years not months. The risk in the near term for this sector is that the economy is much weaker than expected, causing advertisers to pull back to manage earnings. Longer term, the sector must manage the technological changes that increase risks of piracy and/or disrupt their business model (e.g., over-the-top, ad skipping).
Lastly, in the midst of the News Corp scandal, it goes without saying that a key variable for credit analysts is management, and for media companies, it is even more important given the nature of the assets.
Pharmaceuticals
This sector is stepping up to a significant patent expiration cliff whose lost revenues will not be replaced given the insufficient pipeline of new drugs. Companies have been preparing for this by rationalizing their cost structures, making acquisitions, diversifying both horizontally and vertically, and increasing their payouts to shareholders. These actions will come at a cost to bondholders. This is a sector that used to have several credits with triple-A ratings (Merck, Pfizer, Eli Lilly, Abbott). In the intermediate term, we believe ratings for this sector head towards single-A. Having said all that, we expect pharmaceutical companies to benefit from secular growth including the aging population in the U.S. and improving standards of healthcare and faster economic growth in emerging markets. We revised our relative value opinion to “unattractive” for the sector in the beginning of this year, as very tight spreads did not reflect our concern that credit quality will migrate south until growth prospects become more favorable. Year-to-date, this sector has been one of few to generate negative excess returns.
Food, Retail, Household and Personal Products
Commodity price “takers” or companies in these sectors will face headwinds of rising raw material costs at a time when the consumer is deleveraging and unemployment is high. We prefer sectors with more inelastic products, as shown in Exhibit 3. The consumer is not used to inflation and is more accustomed to deflation (apparel, toys, household products). The Commodity Research Bureau’s index of commodity prices has been up at least 20% this year, resulting in a rising Producer Price Index (PPI) while the Consumer Price Index (CPI) has only risen modestly, outpacing PPI by 200 basis points for over a year. Companies have been absorbing this difference due to the fragility of the consumer, protecting margins via productivity improvements and innovation. The companies that have disproportionately benefitted are those more exposed to higher income consumers, who are less sensitive to prices of goods and gasoline.
Exhibit 3: Price Elasticity of Demand (1995 – 2011)
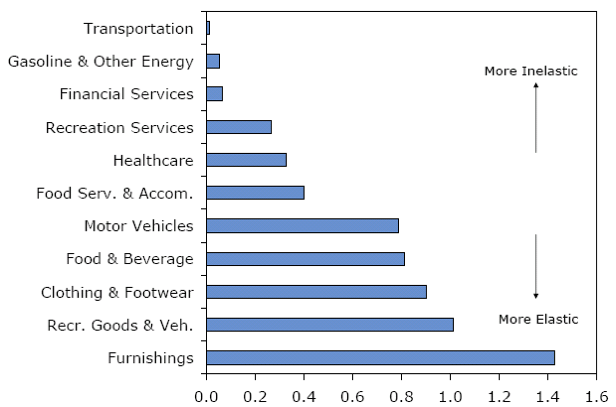
Source: Credit Suisse (U.S. Census Bureau and Wells Fargo Securities, LLC)
While less than one fifth of all U.S. consumers make more than $100,000 annually, this income group accounts for more than one third of all spending. In Retail, spreads reflect this as luxury retailers are trading inside of discount peers, a relationship that is uncommon (See Exhibit 4; average is 30 bps wide of discounters over last 5 years). For the discount and mid-tier retailers, we are concerned that the double digit price increases planned for the second half of the year to offset the 10-20% increase in Cost of Goods Sold (COGS) could prove difficult, as the consumer remains weak and sensitive to rising gasoline prices. Promotional activity drove the better than expected same-store-sale figures released this week, pointing to the difficulty of retailers attempting to raise prices in this environment.
Exhibit 4: Specialty Retailers have Outperformed in this Recovery
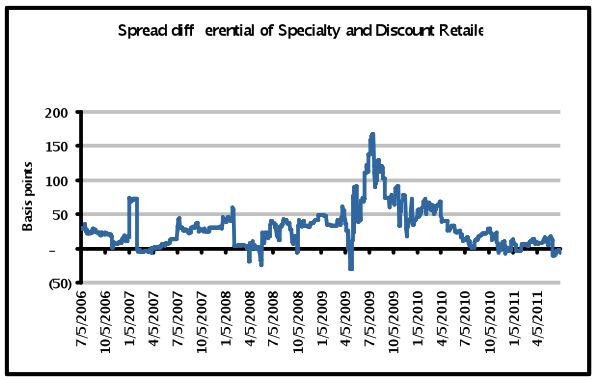
Source: AAM, Credit Suisse (LUCI Index, A rated issuers)
Similarly for food companies, we are concerned that the price increases they have started to implement are becoming increasingly more difficult. There is a lag between the time in which the companies absorb rising input costs and the pace at which they can increase prices to compensate, which is the reason companies hedge raw materials costs. That said, Wells Fargo equity analysts estimate that after the impact of hedges, input cost inflation will average 7-9% in 2011 for these companies (13% without)[1], a level that will be very difficult to offset with higher prices and productivity improvements. The same issue applies to household product companies.
In this environment especially given very tight spreads, we believe the sector is largely unattractive, preferring companies in these sectors that have strong brands, have significant emerging markets exposure, and are deleveraging post acquisition. While we understand many of these companies are of high credit quality, we are concerned that the margin compression and revenue pressure will result in companies becoming more shareholder friendly and/or pursuing cash funded M&A. In addition, given the mature nature of the consumer sector event risk includes pressure from activist shareholders and Leveraged Buyout (LBO) rumor/activity, especially those with smaller market caps.
Telecommunications
This sector is rarely boring and this year has been no exception (See Exhibit 5). As wireless penetration in developed economies approaches or for many, exceeds 100%, companies are searching for ways to grow their top lines while protecting margins. Revenues for European carriers have been pressured either as a result of the weak economies and austerity measures or the price competition that has ensued (France being the latest example). Rating agencies like Standard & Poor’s have revised their methodology to tie ratings of credits that are “sensitive to country risk” to the sovereign ratings, affecting industries like telecommunications and utilities. Hence, the sovereign weakness has not only pressured these credits from a top line perspective but a funding cost perspective as well. We continue to avoid European telecommunications credits, expecting continued fundamental weakness and spread volatility.
In the U.S., the industry has benefitted from the proliferation of smart phones and other connected devices like tablets, with data revenue growth more than offsetting the decline in voice revenues. Recently, companies have effectively increased their prices for data, removing or raising prices for unlimited packages. Given the strain on the network for tablets, we expect marketing emphasis will be placed on smart phones in the near term. The price differential for voice/data packages between the nationwide carriers and the pre-paid or discount companies continues to be meaningful. Family plans and the preference for consumers to own the latest technology has protected this gap, but as smart phones become more affordable and networks are upgraded, this may begin to close at the expense of the larger carriers. For regional telecom companies, we believe their DSL revenues are vulnerable, as the nationwide carriers deploy 4G services. Spreads reflect some of the technological uncertainty in this sector, and we continue to invest cautiously in both credits and maturity.
Exhibit 5: Higher Quality Credits Have Outperformed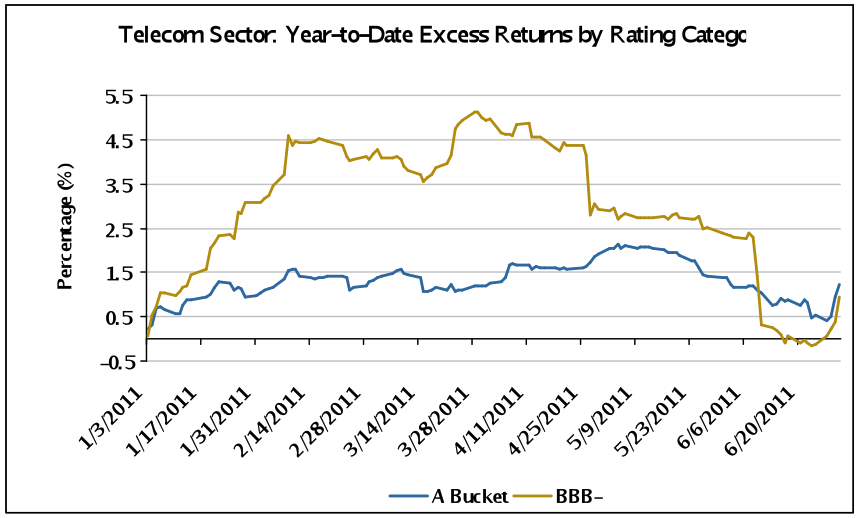
Source: Credit Suisse, AAM
Finance
Banks
Fundamentals continue to improve from a bondholder’s perspective, as charge-offs are improving and tangible common equity and liquidity builds (Exhibits 6 and 7). Despite banks’ desire to lend, loan growth remains stagnant even as Commercial & Industrial (C&I) credit standards ease. Generally, lending is available for businesses but less so for consumers, as home equity loans and construction loans are being run-off. Regulatory related costs – both direct and indirect – have hampered the industry and especially equity valuations. Equity investors question the Return on Equity (ROE) generating ability of the sector, and the latest degree of economic uncertainty only adds to the pressure. In Europe, banks face similar questions on ROE under the Basel III rules in addition to having more exposure to the weak European sovereigns. While we continue to believe the sector is attractively priced for the risks assumed as bondholders, we admit that the market related risk is not decreasing as quickly as we would like. We do not see this changing in the near term unless the debt crisis in Europe is resolved sooner than expected (doubtful) or domestic growth is kick started. We prefer the strong domestic over the European banks and remain cautious as it relates to investing in the capital structure (senior only) and maturity curve (short-to-intermediate).
Exhibit 6:
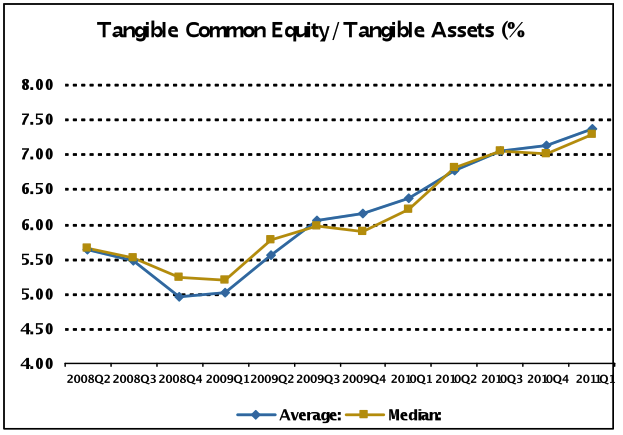
Source: SNL
Exhibit 7: Nonperforming Assets, 25-Bank Aggregate ($ billion)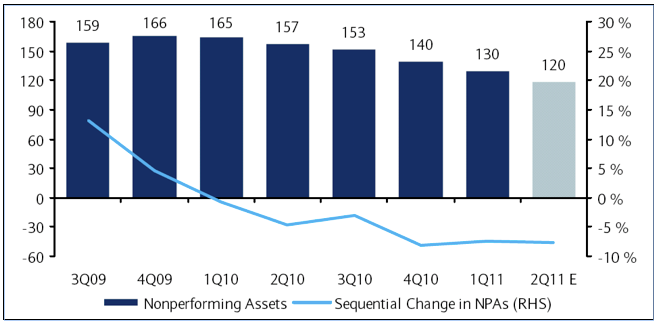
Source: Barclays Capital, SNL
Insurance
Insurance companies are overcapitalized with excess liquidity, which bodes well for bondholders. Not only have most reduced their investment risk, but they have also de-risked on the product side. Spreads have widened over the past couple months, but the sector has performed well year-to-date. Property & Casualty and reinsurance companies have been faced with questions about claims and their municipal exposure, life companies face questions surrounding stock market uncertainty and interest rates, and health companies face uncertainties surrounding the new regulation and political pressure surrounding rates. We are investing in the sector, prioritizing management and companies with strong market positions. We are less concerned about the regulatory pressures facing the health insurers, appreciating the lower level of investment risk and competition. We are avoiding insurance brokers and reinsurers that have tight spreads relative to their risk profiles.
REITs
After looking into the abyss during the financial crisis, management teams continue to remain financially prudent, avoiding large scale M&A and development. Leverage continues to be worked down, and liquidity is good. After a very strong rally earlier in the year, spreads have pulled back. Our preference remains the Multi-family and Central Business District office sector REITs where the supply and demand dynamics are more favorable, leading to rent improvement. REITs have been adding properties via individual asset purchases and continue to sell equity to de-lever and fund acquisitions. Aside from a weaker than expected economic environment, a risk for the sector is a resumption of more aggressive M&A and/or development. That said, we do not believe this is a risk in the near term as large commercial developers are currently understaffed, construction credit is unavailable, and leading indicators are not pointing in that direction (e.g., Architectural Billings Index).
Utilities
Utilities have done well in this pull-back, a sector that is viewed as largely defensive and domestic. We recently revised our Pipeline sector recommendation to Fair from Attractive, viewing spreads as fairly reflecting the fundamental risks (Exhibit 8). This sector is not immune to the economy or political rhetoric (e.g., elimination of the Master Limited Partner (MLP) tax structure). In regard to Electrics, we believe the carbon emissions related rules expected later this year are key variables for credit analysis in the near term, as companies have threatened plant closures and capital spending retrenchment.
Exhibit 8: Pipelines Have Outperformed Electrics Year-to-Date
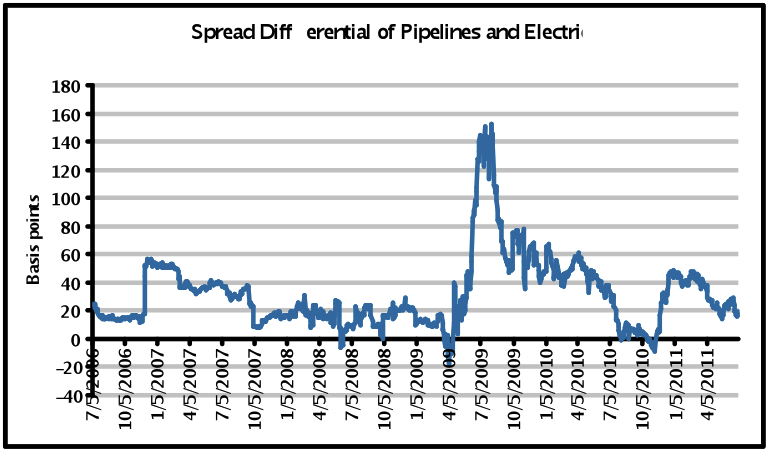
Source: AAM, Credit Suisse – LUCI data for 7-10 year BBB rated Pipelines and Electric Utilities
Written by:
Elizabeth G. Henderson, CFA
Director of Corporate Credit
Disclaimer: Asset Allocation & Management Company, LLC (AAM) is an investment adviser registered with the Securities and Exchange Commission, specializing in fixed-income asset management services for insurance companies. This information was developed using publicly available information, internally developed data and outside sources believed to be reliable. While all reasonable care has been taken to ensure that the facts stated and the opinions given are accurate, complete and reasonable, liability is expressly disclaimed by AAM and any affiliates (collectively known as “AAM”), and their representative officers and employees. This report has been prepared for informational purposes only and does not purport to represent a complete analysis of any security, company or industry discussed. Any opinions and/or recommendations expressed are subject to change without notice and should be considered only as part of a diversified portfolio. A complete list of investment recommendations made during the past year is available upon request. Past performance is not an indication of future returns.
This information is distributed to recipients including AAM, any of which may have acted on the basis of the information, or may have an ownership interest in securities to which the information relates. It may also be distributed to clients of AAM, as well as to other recipients with whom no such client relationship exists. Providing this information does not, in and of itself, constitute a recommendation by AAM, nor does it imply that the purchase or sale of any security is suitable for the recipient. Investing in the bond market is subject to certain risks including market, interest-rate, issuer, credit, inflation, liquidity, valuation, volatility, prepayment and extension. No part of this material may be reproduced in any form, or referred to in any other publication, without express written permission.
[1] Schumaker-Krieg, Diane, “Testing Consumer Spending Power: Every Penny Counts,” Wells Fargo Securities Integrated Research and Economics: TRACS, Vol. 9, (June 2011), pg. 10.
Disclaimer: Asset Allocation & Management Company, LLC (AAM) is an investment adviser registered with the Securities and Exchange Commission, specializing in fixed-income asset management services for insurance companies. Registration does not imply a certain level of skill or training. This information was developed using publicly available information, internally developed data and outside sources believed to be reliable. While all reasonable care has been taken to ensure that the facts stated and the opinions given are accurate, complete and reasonable, liability is expressly disclaimed by AAM and any affiliates (collectively known as “AAM”), and their representative officers and employees. This report has been prepared for informational purposes only and does not purport to represent a complete analysis of any security, company or industry discussed. Any opinions and/or recommendations expressed are subject to change without notice and should be considered only as part of a diversified portfolio. Any opinions and statements contained herein of financial market trends based on market conditions constitute our judgment. This material may contain projections or other forward-looking statements regarding future events, targets or expectations, and is only current as of the date indicated. There is no assurance that such events or targets will be achieved, and may be significantly different than that discussed here. The information presented, including any statements concerning financial market trends, is based on current market conditions, which will fluctuate and may be superseded by subsequent market events or for other reasons. Although the assumptions underlying the forward-looking statements that may be contained herein are believed to be reasonable they can be affected by inaccurate assumptions or by known or unknown risks and uncertainties. AAM assumes no duty to provide updates to any analysis contained herein. A complete list of investment recommendations made during the past year is available upon request. Past performance is not an indication of future returns. This information is distributed to recipients including AAM, any of which may have acted on the basis of the information, or may have an ownership interest in securities to which the information relates. It may also be distributed to clients of AAM, as well as to other recipients with whom no such client relationship exists. Providing this information does not, in and of itself, constitute a recommendation by AAM, nor does it imply that the purchase or sale of any security is suitable for the recipient. Investing in the bond market is subject to certain risks including market, interest-rate, issuer, credit, inflation, liquidity, valuation, volatility, prepayment and extension. No part of this material may be reproduced in any form, or referred to in any other publication, without express written permission.