insight
AAM Corporate Credit View: November 2009
November 2, 2009
The demand for Corporate bonds, especially those with wider spreads, continues. The excess return for October (Barclays Corporate Bond Index – “Index”) was 89 basis points (bps) or 73 bps, excluding hybrids. Finance outperformed Utilities and Industrials, posting 162 bps of return vs. 56 bps and 47 bps respectively. The OAS was 206 bps at month-end compared to 555 bps at year-end 2008. Over the last 20 years, the low point (OAS) was 51 bps in July 1997, ranging from Utilities at 38 bps to Industrials at 58 bps. The yield at that time for the Index was 6.61%, very close to the 20 year mean of 6.74%. The yield for the Index at 10/28/09 was 4.78%, exemplifying the very low rate environment that we are in today.
A lot has changed since 1997. The size of the Index measured by the amount outstanding ($)has changed, growing 135% since 1997, while the number of issues has been reduced by 22% since 1997. This reflects the larger, more liquid deals that facilitate trading and hence, lead to more volatility. The participants in the Corporate market have also changed with a greater number of hedge funds and other trading oriented firms looking to Corporate bonds for investment opportunities (Exhibit 1). Oddly, two things have not changed. First, the credit rating of the Index remains A2/A3, and second, the primary sector composition is virtually the same.
Exhibit 1
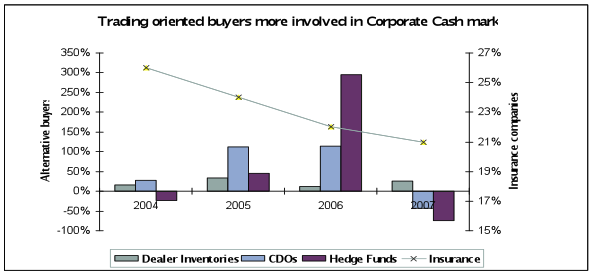
Note: Alternative buyers reflect the percent change in asset increase annually; Insurance is as % of the total holders of Corporate and Foreign bonds. Sources: Federal Reserve Flow of Funds, Thomsen Financial Platinum Database, ABS Alert Van Hedge Fund Advisors International, Hedge Fund Intelligence, Bloomberg, Dealogic’s CP Wave, Merrill Lynch Survey.
Change and specifically, volatility become evident if one splits the last 20 years into decades. Table 1 shows the volatility of Corporate spreads over a 20 year period. Simply, the last 10 years have been less rewarding for bondholders than the prior 10. The annualized total return over the first 10 years for investors in the Index was 8.31% vs. 6.51% over the last 10. And, as you see below, the risk/reward has certainly been less favorable especially for Financials.
| TABLE 1 | 1989-2009 | 1989-1999 | 1999-2009 | |
| OAS – Mean | Corporate | 170 | 84 | 176 |
| (bps) | Industrials | 169 | 93 | 173 |
| Utilities | 173 | 71 | 179 | |
| Financials | 172 | 90 | 176 | |
| OAS – Std Deviation | Corporate | 113 | 23 | 114 |
| Industrials | 89 | 25 | 89 | |
| Utilities | 103 | 19 | 103 | |
| Financials | 156 | 35 | 159 | |
| OAS/Std Dev | Corporate | 2 | 4 | 2 |
| Industrials | 2 | 4 | 2 | |
| Utilities | 2 | 4 | 2 | |
| Financials | 1 | 3 | 1 |
Source: Barclays
Putting the past behind us, the more important question is what can we expect over the next 10 years? Even though spreads have tightened considerably this year, we note that many sectors have not even approached the tights over the last two years let alone the last 10. It is evident from the graph (“Exhibit 2”) below that given the economic and government/fiscal uncertainty, the Corporate bond market continues to demand payment for sectors that are more vulnerable. We believe this higher dispersion around the mean will persist in the near-to-intermediate term or at least until the economy begins to improve organically.
Exhibit 2 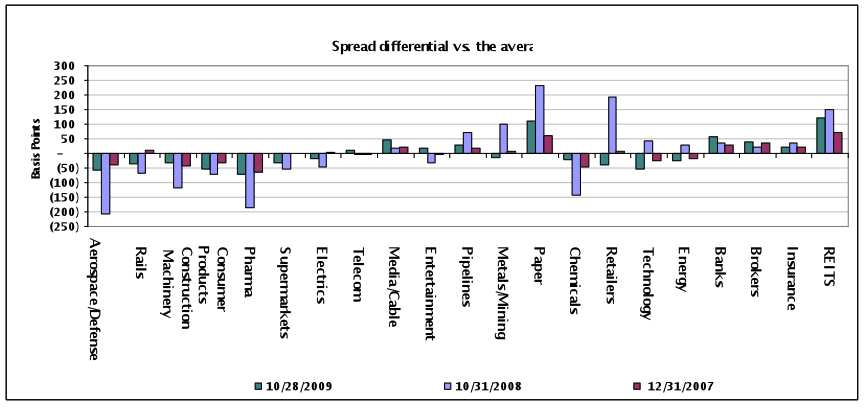
The message rings clear to us. Spread volatility has increased and with default risk expected to remain high over a longer time period[note]Bank of America Merrill Lynch “From Matterhorn to Matanuska” 9/16/2009 – Predictions include: twin default peaks in late 2009and a lower peak in late 2012, a slower rate of improvement from the peak in 2012, cumulative defaults reaching 40% vs. 30% in previous cycles, and a slower return to below average default rates, specifically taking 7-8 years to fully play out vs. the 5-year normal cycle duration.[/note], credit selection is critical. We continue to believe investing defensively and not solely reaching for the highest yielding asset today is critical in this environment for both total return and principal and interest preservation. In 2010, we believe there will be periods of spread widening given our expectation for muted GDP growth, as the government stimulus wanes. Consequently, we generally favor sectors that will benefit from demand overseas, government support, and inventory restocking while avoiding those that are susceptible to event risk or heavily dependent on housing, commercial real estate and/or discretionary consumer spending.
This information is developed using publicly available information, internally developed data and outside sources believed to be reliable. While all reasonable care has been taken to ensure that the facts stated and the opinions given are accurate, complete and reasonable, liability is expressly disclaimed by AAM and any affiliates (collectively known as ‘AAM’), and their respective officers and employees. Any opinions and/or recommendations expressed are subject to change without notice.
This information is distributed to recipients including AAM, any of which may have acted on the basis of the information, or may have an ownership interest in securities to which the information relates. It may also be distributed to clients of AAM, as well as to other recipients with whom no such client relationship exists. Providing this information does not, in and of itself, constitute a recommendation by AAM, nor does it imply that the purchase or sale of any security is suitable for the recipient.
Disclaimer: Asset Allocation & Management Company, LLC (AAM) is an investment adviser registered with the Securities and Exchange Commission, specializing in fixed-income asset management services for insurance companies. Registration does not imply a certain level of skill or training. This information was developed using publicly available information, internally developed data and outside sources believed to be reliable. While all reasonable care has been taken to ensure that the facts stated and the opinions given are accurate, complete and reasonable, liability is expressly disclaimed by AAM and any affiliates (collectively known as “AAM”), and their representative officers and employees. This report has been prepared for informational purposes only and does not purport to represent a complete analysis of any security, company or industry discussed. Any opinions and/or recommendations expressed are subject to change without notice and should be considered only as part of a diversified portfolio. Any opinions and statements contained herein of financial market trends based on market conditions constitute our judgment. This material may contain projections or other forward-looking statements regarding future events, targets or expectations, and is only current as of the date indicated. There is no assurance that such events or targets will be achieved, and may be significantly different than that discussed here. The information presented, including any statements concerning financial market trends, is based on current market conditions, which will fluctuate and may be superseded by subsequent market events or for other reasons. Although the assumptions underlying the forward-looking statements that may be contained herein are believed to be reasonable they can be affected by inaccurate assumptions or by known or unknown risks and uncertainties. AAM assumes no duty to provide updates to any analysis contained herein. A complete list of investment recommendations made during the past year is available upon request. Past performance is not an indication of future returns. This information is distributed to recipients including AAM, any of which may have acted on the basis of the information, or may have an ownership interest in securities to which the information relates. It may also be distributed to clients of AAM, as well as to other recipients with whom no such client relationship exists. Providing this information does not, in and of itself, constitute a recommendation by AAM, nor does it imply that the purchase or sale of any security is suitable for the recipient. Investing in the bond market is subject to certain risks including market, interest-rate, issuer, credit, inflation, liquidity, valuation, volatility, prepayment and extension. No part of this material may be reproduced in any form, or referred to in any other publication, without express written permission.