insight
AAM Corporate Credit View: Spring 2014
March 17, 2014
[toc]
Welcome
We welcome a new format for our Corporate Credit View, replicating our popular AAM Newsletter. Each quarter, we will feature an Investment Grade Corporate bond market summary, discuss changes in credit fundamentals as well as newsworthy developments, highlight sectors we find attractive or particularly unattractive, and close with comments regarding the private placement market.
Market Summary: Credit Market Stays Healthy Through Tough Winter
By Elizabeth Henderson, CFA
Director of Corporate Credit

The Investment Grade Corporate market generated solid performance in the first quarter 2014, with spreads tightening and Treasury yields falling, generating 2.94% total return (0.70% excess return) year-to-date for the Barclays Corporate Index. Industrial BBB rated securities generally outperformed, narrowing the basis between A rated securities from 60 at year-end 2013 to 52 basis points (bps). Volatility has been minimal, with spreads widening 7 bps during the emerging market sell off in late January, and then retracing to close 8 bps tighter year-to-date. The market OAS has moved inside our target for 2014; therefore, we expect performance for the remainder of the year to be driven by income rather than spread tightening.
Technically, demand remains very strong for Investment Grade securities. The secondary market has benefited from positive fund flows, and new issues continue to be well oversubscribed with little concession versus outstanding securities.
The biggest change year-to-date has been the performance across the curve. Last year, short and long end spreads outperformed; whereas this year, intermediate (7-10 year) spreads have outperformed. We believe this reflects investors’ relatively benign expectations for rising interest rates after the move last year and the weak economic data received year to date. Credit curves have changed (5-year to 10-year spreads have flattened while 10-year to 30-year spreads have steepened), and we expect long end demand will increase for corporate spreads once 30-year rates increase. Rate expectations for mid-year 2014 have been modified down by 30-50 bps vs. the start of the year.
Rate expectations reflect weaker U.S. economic data, arguably due to the harsh winter, while data from China has disappointed as well. The weakness in China partly reflects the reforms put in place by the new regime, affecting Investment Grade companies to various degrees. The Chinese government has not been spending at the pace it once was on technology, nor is the wealthy on cars, apparel and even wine. Even though Chinese Premier Li Keqiang ruled out major stimulus after weak trade data this week, the government has announced tax breaks for small firms to hasten infrastructure spending, benefitting the rail sector and other under developed or invested areas. The government has the resources to support/stimulate GDP growth, but has to be cautious given the rapid increase in local debt. Despite the soft U.S. quarter and the negative data from China, the expectation for 2014 worldwide GDP growth has stayed firm at 2.81% today vs. 2.83% on December 31, 2013 per Bloomberg (reflects the consensus).
Corporate merger and acquisition activity has increased, with the number of deals up 10% per Bloomberg year-over-year. The vast majority has occurred in the U.S. (20% year-over-year) vs. Europe (3%) and Asia Pacific (1%). Approximately half the activity has been in the Communications and Consumer NonCyclical sectors, seeking to benefit from increased economies of scale and/or cost cutting.
After analyzing 2013 results, credit metrics remained healthy. Capital spending was weaker in the fourth quarter, but the projection for 2014 improved. We expect the companies in our investment grade universe to increase spending close to 5% vs. 2013. This compares to the expectation for much stronger spending for companies in the S&P 500 Index. Industries such as Healthcare, Aerospace/Defense, and Technology represent a larger portion of the S&P 500 vs. the Investment Grade Corporate bond market. These sectors are expected to grow capital spending more than 6% in 2014. Sectors that are expected to pull back capital spending this year include: Integrated Energy, Metals & Mining, and Construction Machinery.
In general, we have been advocating BBB securities vs. A rated for the attractive risk adjusted income. In 2013, nonfinancial BBB credit fundamental improvement exceeded that for A rated credits, as did U.S. credits vs. those domiciled outside the U.S. (highlighted in Exhibit 1). We note EBITDA margins remained stagnant year over year, and unless revenue growth improves this year, companies will remain highly focused on costs.
As shown in Exhibit 2, margins for commodity based companies reflect falling oil and metals prices while transportation companies have benefited from shale production in the U.S. as well as technology improvements. Consumers are spending more on big ticket items and leisure, benefitting the more cyclical companies (e.g., autos, hotels) vs. noncyclical (e.g., food, household products).
Exhibit 1
| Fundamental Comparison of NonFinancial companies in 2013 vs. 2012 | ||||
| A/better | BBB | U.S.U.S. | Non U.S. | |
| Revenue growth | 1% | 3% | 3% | 1% |
| EBITDA growth | 1% | 5% | 5% | -1% |
| Free Cash Flow growth | up sd | up dd | up dd | down dd |
| Leverage | +0.1x | +0.1x | ||
| Cash/Debt | +1 ppt | +0.1x | flat | flat |
| Capex/Revenues | flat | +2 ppts | +2 ppts | flat |
| Dividends/CFO | +1 ppt | flat | flat | +1 ppt |
| M&A/CFO | -5 ppts | -1ppt | +1 ppt | -6 ppts |
| Net Share repurchase/CFO | +4 ppts | -2 ppts | -3 ppts | flat |
| -2 ppts | +2 ppts | |||
Source: AAM, CapitalIQ using a subset of approximately 550 companies
Legend: ppt = percentage point; sd = single digits; dd = double digits; x + times
Exhibit 2
| EBITDA Margins | 12/31/2013 | 12/31/2012 |
10 year Maximum |
10 year Average |
| Basics | 18.6% | 18.8% | 24.3% | 20.3% |
| Capital Goods | 15.1% | 14.3% | 15.3% | 14.5% |
| Communications | 30.3% | 27.9% | 32.1% | 30.3% |
| Energy | 15.5% | 16.8% | 21.1% | 17.7% |
| Cyclicals | 12.3% | 11.3% | 13.7% | 11.1% |
| Noncyclicals | 15.6% | 15.7% | 16.8% | 15.9% |
| Technology | 24.7% | 25.2% | 25.2% | 22.0% |
| Transportation | 28.7% | 26.9% | 28.7% | 23.9% |
| Electric | 29.2% | 29.4% | 29.4% | 26.9% |
| Gas | 30.4% | 32.2% | 32.2% | 26.1% |
Source: AAM, CapitalIQ using a subset of approximately 550 companies
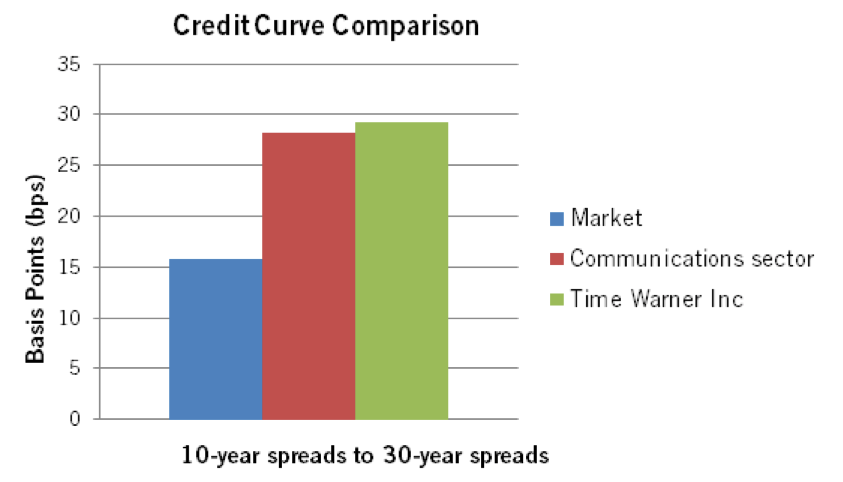
We took advantage of steeper 10-year to 30-year credit curves (Exhibit 3) and relatively wider spreads in the Media sector after companies increased their leverage targets last year. Over the near term, we expect capital structures to remain stable and television/cable networks to benefit from affiliate fee contract increases of 7-8% and a healthy advertising market. The world’s largest advertising agency’s (WPP) CEO commented at a recent conference that advertising in the U.S. and Western Europe was stronger than they had expected during February and March, resulting in revenue growth of 6%, outpacing their 3% target expected for 2014. Original content continues to be in demand from traditional buyers as well as nontraditional buyers such as Amazon and Yahoo. We prefer media credits with production studios, conservative management teams and networks with strong brands. While we acknowledge the risk to the networks if the distributors (e.g., Comcast (CMCSA)/Time Warmer (TWC), Direct TV (DTV)/DISH) consolidate, we view that as a risk over the intermediate term. Credits we favor include: Omnicom, WPP, Time Warner Inc. and Fox.
Original content continues to be in demand from traditional buyers and non-traditional buyers
Exhibit 3

The Oilfield Services (OFS) subsector continues to be among the widest trading in the investment grade universe with a quarter-end OAS of 139 bps versus 105 bps for the broad Industrial sector. Notably, the OFS subsector includes both contract drillers such as Ensco, Transocean, Noble Drilling and Diamond Offshore as well as service companies such as such as Schlumberger, Halliburton and Baker Hughes. The capital intense contract drillers comprise about 50% of the market value of the OFS subsector and they currently provide about 50 bps of incremental yield to the very high quality service credits. As Exhibit 4 shows, investors can pick up yield relative to BBB Industrials across the curve by owning contract drillers.
Exhibit 4
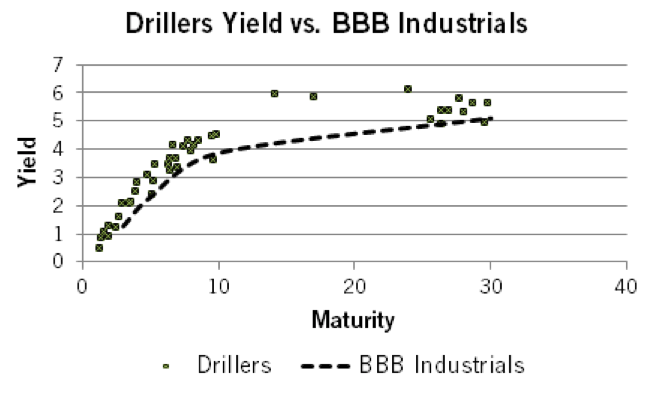
Source: AAM (Spread Master & Final Industrial Matrix), Bloomberg
We believe there are several reasons that the contract drillers are providing yields greater than similarly rated Industrials. First, there is concern regarding a large amount of new rigs entering the market in the next several years, which could put pressure on drilling rig rental rates. Secondly, there is a fear that the Independents, Integrateds, and state run oil companies may reduce drilling activities and focus on better returns. Additionally, the largest market for deep-water drilling rigs is Brazil, where drilling activities have slowed in the past 18 months.
We believe these headwinds are short term in nature and that structural support for deep-water drilling remains intact. First, we believe that strong oil and international gas prices are sustained by world economic growth of more than 3%. Secondly, we believe the concern about excess supply of rigs will ease as some new rigs replace older rigs rather than add to overall supply. Finally, given the reforms of the energy market in Mexico, we believe substantial incremental deep-water activity could begin in the latter half of 2015.

As part of the Dodd-Frank Act, U.S. banks with more than $50 billion in assets are required to undergo annual stress tests and a review of their capital plans (i.e., dividend/buy-back plan) administered by the Federal Reserve. The stress test measures the ability of banks to withstand a hypothetical economic and market downturn while maintaining minimum Tier 1 capital ratios. Results of the stress test were released March 21, 2014 with 29 of 30 banks under review passing on a quantitative basis (Zions Bancorp was the lone failure). This was followed by release on March 25, 2014 of the Comprehensive Capital Analysis and Review (CCAR) which is also administered by the Federal Reserve and takes into account the results of the stress test and the proforma impact of the dividend and buybacks requested. In contrast to the stress test, five banks had their capital plans rejected (most notably Citigroup, but also HSBC North America, RBS Citizens, Santander USA and Zions). Additionally, several banks including Bank of America were told to revise their capital plan submissions before they were approved.
The rejection of Citi’s capital plan was surprising (and embarrassing) to management, which had been working to overcome past stumbles in the CCAR process. The Federal Reserve noted that the rejection was due to qualitative rather than quantitative reasons (Citi exceeded the stress test minimum capital requirements). Although details of the stress test and CCAR, as well as specifics of the rejected capital plan were not released by the Federal Reserve, they did note qualitative concerns about Citi’s ability to model losses in its foreign subsidiary loan books in an extreme stress case. This deficiency was apparently identified in previous years and the regulator felt that sufficient progress was not made in addressing the situation.

Private placement deal volume was down 25% year-to-date as of March 31, 2014 vs. the same period last year[note]Anthony Napolitano, “Parsons Takes $250 Million Out of the Market,Private Placement Monitor, vol. 26 (2014), no. 48, page 6.[/note]. The expectation is that volume picks up over the course of the year. Cross border transactions accounted for the majority (approximately 60%) of the issuance, which is unlikely to persist. We continue to find private placements attractive, but remain selective, avoiding deals we consider NAIC 3 quality that are being marketed as NAIC 2. Project finance issuance has been predominantly Latin American with deals from Peru, Chile, and Mexico.
For more information about AAM or any of the information in the Corporate Credit View, please contact:
Colin Dowdall, CFA, Director of Marketing and Business Development
John Olvany, Vice President of Business Development
Neelm Hameer, Vice President of Business Development
Disclaimer: Asset Allocation & Management Company, LLC (AAM) is an investment adviser registered with the Securities and Exchange Commission, specializing in fixed-income asset management services for insurance companies. This information was developed using publicly available information, internally developed data and outside sources believed to be reliable. While all reasonable care has been taken to ensure that the facts stated and the opinions given are accurate, complete and reasonable, liability is expressly disclaimed by AAM and any affiliates (collectively known as “AAM”), and their representative officers and employees. This report has been prepared for informational purposes only and does not purport to represent a complete analysis of any security, company or industry discussed. Any opinions and/or recommendations expressed are subject to change without notice and should be considered only as part of a diversified portfolio. A complete list of investment recommendations made during the past year is available upon request. Past performance is not an indication of future returns.
This information is distributed to recipients including AAM, any of which may have acted on the basis of the information, or may have an ownership interest in securities to which the information relates. It may also be distributed to clients of AAM, as well as to other recipients with whom no such client relationship exists. Providing this information does not, in and of itself, constitute a recommendation by AAM, nor does it imply that the purchase or sale of any security is suitable for the recipient. Investing in the bond market is subject to certain risks including market, interest-rate, issuer, credit, inflation, liquidity, valuation, volatility, prepayment and extension. No part of this material may be reproduced in any form, or referred to in any other publication, without express written permission.
Disclaimer: Asset Allocation & Management Company, LLC (AAM) is an investment adviser registered with the Securities and Exchange Commission, specializing in fixed-income asset management services for insurance companies. Registration does not imply a certain level of skill or training. This information was developed using publicly available information, internally developed data and outside sources believed to be reliable. While all reasonable care has been taken to ensure that the facts stated and the opinions given are accurate, complete and reasonable, liability is expressly disclaimed by AAM and any affiliates (collectively known as “AAM”), and their representative officers and employees. This report has been prepared for informational purposes only and does not purport to represent a complete analysis of any security, company or industry discussed. Any opinions and/or recommendations expressed are subject to change without notice and should be considered only as part of a diversified portfolio. Any opinions and statements contained herein of financial market trends based on market conditions constitute our judgment. This material may contain projections or other forward-looking statements regarding future events, targets or expectations, and is only current as of the date indicated. There is no assurance that such events or targets will be achieved, and may be significantly different than that discussed here. The information presented, including any statements concerning financial market trends, is based on current market conditions, which will fluctuate and may be superseded by subsequent market events or for other reasons. Although the assumptions underlying the forward-looking statements that may be contained herein are believed to be reasonable they can be affected by inaccurate assumptions or by known or unknown risks and uncertainties. AAM assumes no duty to provide updates to any analysis contained herein. A complete list of investment recommendations made during the past year is available upon request. Past performance is not an indication of future returns. This information is distributed to recipients including AAM, any of which may have acted on the basis of the information, or may have an ownership interest in securities to which the information relates. It may also be distributed to clients of AAM, as well as to other recipients with whom no such client relationship exists. Providing this information does not, in and of itself, constitute a recommendation by AAM, nor does it imply that the purchase or sale of any security is suitable for the recipient. Investing in the bond market is subject to certain risks including market, interest-rate, issuer, credit, inflation, liquidity, valuation, volatility, prepayment and extension. No part of this material may be reproduced in any form, or referred to in any other publication, without express written permission.