Economic Outlook – Marco Bravo, CFA | Senior Portfolio Manager
Market Outlook – Reed Nuttall, CFA | Chief Investment Officer
Corporate Credit – Elizabeth Henderson, CFA | Director of Corporate Credit
Structured Products – Scott Edwards, CFA | Director of Structured Products
Municipal Market – Gregory Bell, CFA, CPA | Director of Municipal Bonds
High Yield – Scott Skowronski, CFA | Senior Portfolio Manager
Convertibles – Tim Senechalle, CFA | Senior Portfolio Manager
Economic Outlook
Our 2022 economic outlook is predicated on three key themes. First, GDP growth is expected to moderate in 2022 but remain relatively strong. Second, inflation should decline throughout the year although the risks are skewed to the upside. Third, the Federal Reserve has done a complete pivot and is ready to tighten monetary policy.
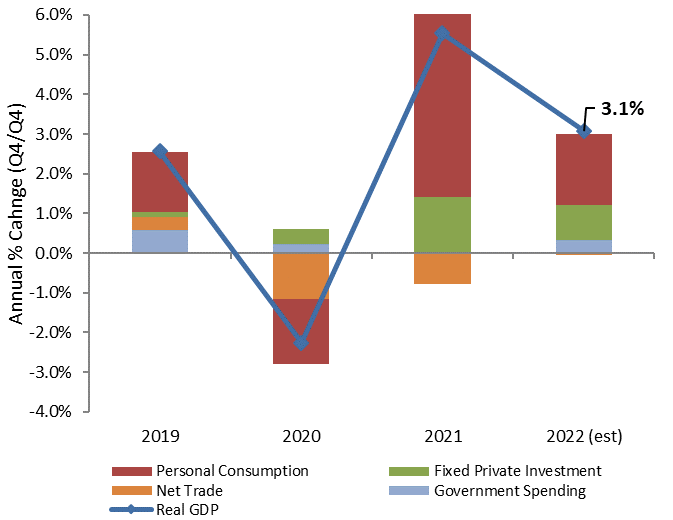
Following a 5.5% increase for 2021 (Q4/Q4), U.S. real GDP is projected to increase by 3.1% this year (Bloomberg). Similar to last year, consumer spending and private investment are expected to be the primary contributors to growth (see exhibit 1). The fundamentals underlying the economy are starting the year off on a healthy note as both households and corporate balance sheets are in a relatively strong position. From Q4 2019 through the Q3 2021, US households gained nearly $27trn (+25%) in net worth (Barclays Capital). On the corporate side, leverage is down and corporate balance sheets are flush with cash. According to estimates from S&P/FactSet, corporations are expected to increase capital spending by almost 20% in 2022. Key downside risks to growth include tighter monetary policy, continued supply-chain disruptions, and persistent inflation. At AAM, we view the risks to GDP growth as balanced.
Exhibit 1: Contribution to GDP Growth
Consumer prices over the 12-month period ending January 31, 2022 increased by 7.5%, representing a 40-year high (Bureau of Labor Statistics CPI). Increased consumer demand for goods, supply disruptions, and rising commodity prices were the primary drivers of inflation last year. As demand begins to normalize and supply-chain issues resolve themselves, CPI is projected come down and increase by 3.1% for 2022 (Bloomberg). With the labor market having recovered, wage pressures have been increasing as companies deal with a shortage of workers. We believe rising wages as well as continued supply-chain disruptions represent key inflation risks going forward. AAM views the risks to inflation as skewed to the upside and expects it will remain above consensus and above the Fed’s target.
With inflation running well above the Fed’s 2% target, the Fed was forced to recently abandon on its assumption that inflation pressures were transitory and pivot to a more hawkish stance. As the labor market has improved to being near full employment, the Federal Reserve appears ready to begin raising interest rates. Based on the most recent Blue Chip Financial Forecasts, the consensus expects a total of four, 25bps hikes in 2022, and three more in 2023. The market appears to be pricing in a more aggressive Fed with Fed Funds futures currently pricing in five to six rate increases this year per Bloomberg. The Fed has also signaled that they may begin reducing their balance sheet this year, otherwise known as Quantitative Tightening (QT). The consensus is forecasting the Fed to begin reducing its balance sheet in the third quarter (Blue Chip Financial Forecasts). We believe the Fed will need to be sensitive to market conditions and not allow financials conditions to tighten to a point that risks choking off growth. AAM is in line with the consensus forecast with respect to Fed policy for 2022.
With the market now pricing in Fed rate hikes, Treasury yields have moved higher and the yield curve has flattened. The yield difference between the 10yr and 2yr Treasury notes peaked last March at 158bps and as of 1/31/2022, stood at 60bps (Bloomberg, US Treasury). The benchmark 10-year Treasury yield is forecasted to end 2022 at 2.2% based on the median forecast among economists surveyed by Bloomberg. Persistently high inflation and reduced buying from the Fed present upside risks to the forecast while a geopolitical event like a Russian invasion of the Ukraine would result in a flight-to-quality and lower Treasury yields. We are calling for the 10-year Treasury yield to end the year in a range of 2.00% to 2.25%. We think the yield curve will continue to flatten but do not expect the curve to invert.
Market Outlook
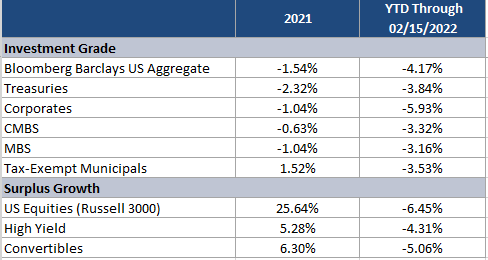
Exhibit 2: Asset Class Returns
2021
We began 2021 with a very accommodative Federal Reserve (FED), strong markets and tight credit spreads. The uncertainty related to when we might get back to work and how many office buildings or stores or hotels will be needed was not reflected in market prices. The markets seemed to be once again reflecting the best-case scenario with little upside from spread tightening and some downside in the event the vaccine rollout was less than smooth. In this environment, the FED continued to keep its foot on the gas. The Federal government also felt the need to pile on and because of the hubris of Congress, we did not get another $4-5 trillion stimulus package across the finish line before year end.
By late in the third quarter, the FED began to realize that it was well behind the inflation curve and began indicating that fiscal stimulus would be coming to an end. The plan was to reduce the amount of Treasury and MBS purchases to zero by March 2022 and start raising the FED funds rate thereafter. The result was rising shorter term interest rates as the market prepared for the tightening to come.
2022
As 2022 progresses, we see significant issues (Ukraine, China, the next CoVid variant) arising almost weekly; however, we believe the primary issue of 2022 for our markets and AAM’s investors is inflation. The FED has promised to be aggressive in reducing the stimulus applied over the last several years by raising the Fed Funds rate and letting their balance sheet (which has grown to $8.9 trillion) begin to shrink through maturities. The geopolitical noise that is surrounding the globe will likely cause increased volatility throughout the markets, but the key issue will likely be inflation.
As the FED exits the MBS market, we have seen spreads widen to reflect the actual prepayment risk in that sector. We expect to see further widening in the coming months and an opportunity to add to our very underweighted positions at attractive levels.
Our fixed income portfolios are built to seek to maximize income while reducing downside risk. We consistently overweight spread sectors but we strive to be flexible in our allocations. We use long Treasuries and Taxable Municipals to reduce price volatility. This strategy has worked so far this year as global uncertainty has been pushing Corporate spreads wider.
We continue to believe that good opportunities to add yield and stability within our portfolios are available. We have overweights to Corporates, ABS, CMBS and Taxable Municipals. We are significantly underweight short Treasuries and Agency-backed MBS. The investment portfolios may experience some underperformance if credit spreads move significantly wider from this point. With limited MBS exposure, we believe that the volatility in interest rates will not have a significant impact on the duration within our portfolios. When duration drift is limited during periods of rising rates, we typically see these types of portfolios outperform less-stable portfolios.
Equities
The signal to reduce our portfolios to their target weight after significant gains is when the 200-day moving average declines below the current level of equities at month-end. This occurred on January 31st, so we worked with our clients whose portfolios had exceeded their equity targets due to market appreciation to reduce their position to match their strategic targets. We believe that we will see further volatility in this sector in the coming months as the FED reduces its stimulative posture. Equities are expensive from most historical metrics and caution is warranted in the sector.
Corporate Bonds
Corporate bonds performed well in 2021 despite starting the year with lofty valuations. The excess return over Treasuries for the Corporate market per the Bloomberg Barclays Index was 1.6%, helping to offset the impact of higher Treasury rates on total returns. Longer maturities and BBB rated bonds generally outperformed, as risk premiums compressed given very favorable supply and demand technicals as well as solid fundamental improvement. This year, we expect a less favorable technical back-drop as monetary and fiscal stimulus are removed. While fundamental improvement is expected to continue, we believe companies will reduce their lofty cash balances, increasing share buybacks along with continued capital investment, acquisitions and some debt reduction. Our expectation is for the OAS to trade in a wider range (85-125) as we move from the beginning to middle point of the credit cycle and volatility normalizes. Our expectation is for excess returns to be miniscule with security selection driving performance. We prefer investing in credits and sectors that are expected to deleverage and outperform fundamentally as well as benefitting from a higher OAS. Those we dislike generally have a higher risk of increased share repurchase and M&A as well as fundamental headwinds such as elevated inflation along with having lower spreads. Examples of the former include Independent Energy, Midstream, Rails, Telecom, Tobacco, Aerospace Defense, U.S. banks and office REITS. Those we expect will underperform include: Construction Machinery, Consumer Products, Food, Life Insurance, and Technology. We expect net supply to fall in 2022, and liability management exercises to continue. We also expect more ESG related issuance. From a demand perspective, we expect pension demand to remain supportive while foreign investor demand may wane with higher hedging costs.
Structured Products
Structured products experienced another year of mixed results in 2021 as smaller sub-sectors such as CMBS and ABS outperformed their Treasury benchmarks by 143bp and 31bp respectively while the largest sub-sector Agency RMBS once again underperformed Treasuries by 64bp (Bloomberg, Internal AAM Material). Our strategy over the past number of years has been to limit our exposure to the agency mortgage market, often significantly so relative to our benchmarks, while emphasizing non-index sub-sectors such as non-agency RMBS and CLOs along with CMBS and ABS. Despite an increase in volatility and a widening credit spreads in the latter half of 2021, AAM observes that spreads across the risk spectrum remain relatively low compared to their 5 year averages. While both interest rates and credit spreads may move higher in 2022, we expect this strategy will continue to benefit our portfolios in the coming year.
Agency RMBS underperformed all major benchmark sectors on an excess return basis in 2021 despite benefiting from consistent monthly purchases by the Federal Reserve. Since pandemic related purchases began in early 2019, the Fed has expanded its holdings of agency mortgage backed securities by $1.2T to $2.6T. They currently hold almost one third of the outstanding supply of agency mortgage backed securities yet during the recent episode of quantitative easing, QE4, Agency RMBS have underperformed Treasuries on an excess return basis 2 of the past 3 years and since the conclusion of QE3, 5 of the past 7 years (Bloomberg, Bank of America).
We expect the Fed to conclude QE4 by March of this year. The real interesting question becomes at what point do they begin to shrink their balance sheet and at what pace. The general consensus is that quantitative tightening, the process of shrinking their balance sheet, will begin this year in the late summer or early fall. During the last episode of quantitative tightening, the mortgage securities on the Fed’s balance sheet were allowed to run off at a rate that peaked at $20B per month. With much larger holdings this time around some have suggested that the rate could be as high as $40B/month. If this is in fact the case, the Fed would cease all Agency RMBS purchases at the outset of QT, leaving other market participants to absorb the excess supply. This possibility leaves the market in an extremely poor technical position. While we would expect to have some opportunities to add securities during the year at times of heightened volatility, it’s likely the loss of the Fed’s presence in the market does not bode well for their performance over the entirety of the year.
As an alternative to agency RMBS, we believe other non-index sectors look more compelling particularly Non-Agency RMBS. While these securities are subject to prepayment risk just like Agency RMBS, the lack of a government guarantee adds an additional layer of risk. The credit performance of the sector is largely driven by the economic health of the homeowner and the strength of the housing market. With respect to housing, constrained supply and sky rocketing demand fueled a surge in housing prices that on a national basis rose 18.4% in 2021 per Bloomberg. While demand is expected to cool in 2022 due to rising mortgage costs, most market participants still see a continuing supply and demand imbalance leading to further price appreciation of 6% to 8% in 2022 (Credit Suisse Research). Solid housing fundamentals and a homeowner flush with cash can provide a very supportive credit environment for non-agency RMBS market and we view the sector as providing a better investment opportunity relative to the Agency RMBS market.
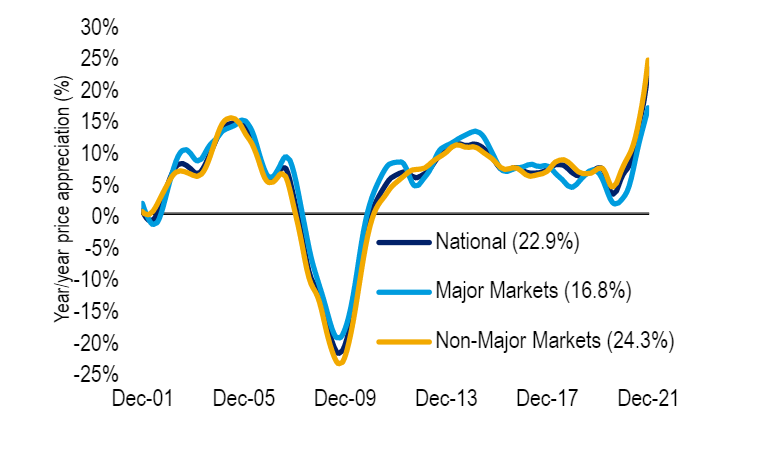
Exhibit 3: Residential MBS

Another attractive sector is CMBS where we continue to find compelling value but still have to question what the post pandemic world may look like. Assessing how the hybrid work model may depress valuations in the central business district as well as will consumers return to brick and mortar shopping and when might they begin to travel again reviving the moribund hotel sector. While it will take years to fully sort out, our premise is that superior, A quality properties will likely thrive in a more competitive environment at the expense of older B and C type locations. But if you look more closely, despite these well publicized questions facing the commercial property market, the underlying credit fundamentals on a broad national basis have been improving rapidly. The average operating performance of all major commercial property sectors as measuring by net operating income increased 4.0% last year per JPM and is forecast to rise another 5.1% in 2022 per Bank of America. Reflecting that performance, Nationwide commercial property prices increased 22.9% last year with even greater gains in non-major markets. While investing in this sector still requires careful analysis and stress testing of individual securitizations, improving credit fundamentals nationwide will help limit credit defaults driving security valuations. We continue to favor senior, Aaa rated structures and see value where trading with yields 10-15bp higher than single A rated corporate bonds.
Exhibit 4: CRE Prices for Properties Located in Major Markets vs. Non Major Markets
ABS continue to anchor our portfolios at the short end of the yield curve. On a historical basis ABS has always been one of the most consistent performers in the Structured Products universe. High credit quality and stable cash flows can make them a valuable alternative to corporate bonds and short duration mortgage backed securities. Much like last year, securitizations from larger more well know issuers are trading at fairly unattractive levels. Demand from investors seeking refuge from rising interest rates have contributed to over extended valuations. We believe smaller more niche sectors such as railcar, airline, and other equipment trusts still provide compelling value relative to other short maturity options. In addition, we’ve also been expanding our holdings of CLOs. The floating rate nature of the securities can provide one of the few defenses against rising interest rates and generally don’t suffer from the market to market pricing losses of fixed rate securities. We expect the underlying credit performance of the underlying leverage loans to be supportive of performance as defaults and delinquencies continue to drop and they remain one of our top picks in the below investment grade market.
Municipal Market
During 2021, the municipal bond sector benefited from both the strong U.S. economic recovery and from fiscal stimulus that helped bolster underlying fundamentals for the sector. Tax revenues during the year have been running ahead of expected levels and have generally provided a stabilized budget profile for state and local issuers. In addition to these tailwinds for the sector, demand for tax-exempt assets by retail investors helped produce record inflows of $102 billion into municipal mutual funds during the year (Lipper). The expectation for higher personal taxes to help fund President Biden’s legislative agenda, along with the improving credit profile for the sector, were likely the principal drivers for the record demand levels, in our opinion. The net result for the tax-exempt sector was strong market performance returns of 1.52% for the Bloomberg IG Muni Bond Index (Bloomberg, JP Morgan).
Taxable municipals also benefitted from strong demand, as very attractive relative valuation levels to tax-exempts attracted solid interest from both retail and institutional investors. The favorable demand technicals provided more than enough support to easily absorb the $142 billion (includes corporate cusips) in taxable muni new issuance during the year (Bond Buyer, Citigroup). This amount was the third highest on record. Performance results were also very strong for the sector with the Bloomberg Taxable Muni Index producing a return of .94% (Bloomberg, JP Morgan).
In looking forward to 2022, we view tax-exempts as an unattractive sector, while we have a neutral bias for the taxable municipal sector. The negative bias for the tax-exempt sector is largely based on the very expensive relative valuations to taxable alternatives. To start the year, muni-to-Treasury ratios in the 10yr maturity were at 68% relative to a 3-year average of 89%. Down the yield curve, valuations are even more extreme, with the yield ratio in the 5 yr maturity at 46% versus the 3-yr average of 83% (Bloomberg, Refinitiv). We view these levels as unsustainable. Current relative valuation levels have largely been a function of the strong seasonal flows that occur around the end of the year from elevated reinvestment flows of coupons/calls/maturities. The market also continued to benefit from the surge in weekly mutual fund inflows that averaged $941 million per week during December (Lipper). The favorable technical backdrop allowed muni yields to remain unchanged between December 6th and December 31st, while 10yr Treasury yields were on an upward trajectory of 17bps (Bloomberg, Refinitiv). Historically, during periods of rising rates, municipal mutual fund inflows tend to turn negative, and with 10yr Treasury rates rising another 35bps during the first 3 weeks of 2022, our view is that this will eventually bleed into less favorable liquidity for the sector. So far, we’ve already seen selling pressure develop for the sector that’s resulted in bid list activity to average $803 million per day since January 6th, an increase of 45% versus the daily average of $554 million during December (Bloomberg, MSRB). In our opinion, as the market continues to grapple with the uncertainty related to the potential for a more hawkish Federal Reserve during 2022, interest rate volatility will likely lead to more selling pressure and less favorable demand technicals for the sector throughout the year.
For the taxable muni sector, we have a more neutral bias for the sector. Broker/dealer expectations for new issuance in the sector is expected to remain manageable, with a total of between $125 to $135 billion. Approximately half of this amount is expected to be sourced from taxable advance refundings. The range of estimates are for between $40 billion to $80 billion of this type of issuance and it will depend on both the levels of interest rates during the year and the legislative agenda. (Barclays, Citigroup, JP Morgan, Bank of America). The Build Back Better Act that’s currently being held up in the Senate, could potentially contain the restoration of tax-exempt advance refundings. If the bill passes with this provision, we believe tax-exempt issuance could increase by $100 to $150 billion (Barclays, Citigroup, JP Morgan, Bank of America), which would drastically decrease taxable advance refundings. However, we view this as a remote possibility. Senator Joe Manchin, WV, has been very firm on limiting the overall size of the legislature to $1.75 trillion, and the cost to include muni-centric provisions like tax-exempt advance refundings and direct-pay bonds for funding infrastructure are expected to be left out in favor of other agenda items. Consequently, the only avenue available for muni issuers to advance refund outstanding tax-exempt debt will continue to be the taxable muni sector. In our opinion, we could potentially see the majority of any refinancing/refunding supply skewed to the first half of the year, as issuers try to take advantage of compelling debt service savings before Treasury rates increase further.
From a relative valuation standpoint, we are not expecting to see any significant spread adjustment during the year. Although spread levels are near historical tights, they are in line with the 5yr average historical relationship to ‘A’ rated corporates. Additionally, when taxable muni yields at year-end 2021 are compared to tax-adjusted tax-exempt yields (adjusted using 21% corporate tax rate) for insurance company investors, taxable munis exhibit a yield advantage of between 63 to 71 bps across the yield curve (Bloomberg, Refinitiv, AAM). In our opinion, the compelling relative yield profile of taxable munis should continue to attract institutional investors and help support and stabilize spread levels for the sector.
Exhibit 5: Tax-Exempt Relative Valuation Levels Remain Unattractive for Insurers

Exhibit 6: Taxable Munis: Compelling Alternative to Tax-Exempts
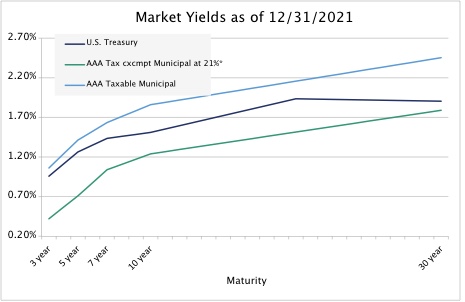
*21% Corp Rate Tax-Adjusted at a Factor of 1.1994
High Yield
Exhibit 7: US Below Investment Grade Valuations
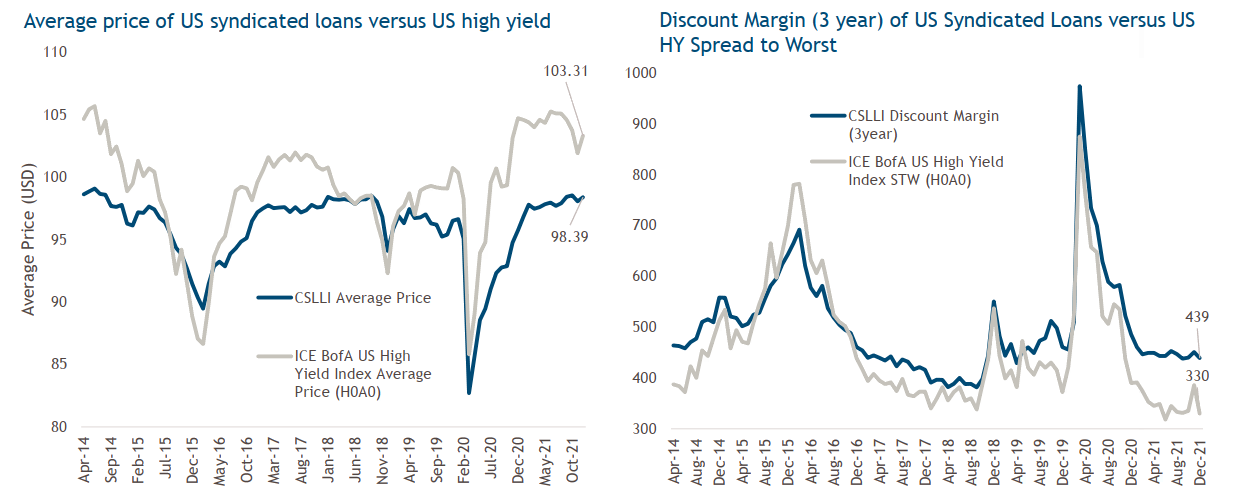
Source: Bloomberg and Credit Suisse Leverage Loan Index (CSLLI). Data as of December 31, 2021. ICE BofA ML US Cash Pay High Yield Constrained Index (H0A0). Loan Market referenced above refers to the Credit Suisse Leveraged Loan Index (CSLLI) as of December 31, 2021.
US High Yield ended 2021 with strong positive returns as the sector continued to benefit from improving fundamentals, declining defaults, and strong institutional demand given the search for income. Credit spreads for the ICE BofA High Yield Index began the year at +390 and tightened 60 basis points to end the year at +330. Given the spread contraction and attractive coupons, total returns were 5.36% for US High Yield, with the lower quality segments outperforming higher rated issuers. The CCC and lower rated portion of the market produced returns of 10.26% while BB/B quality issuers performed 4.58% during 2021. Syndicated Loan returns were also strong at 5.40% as demand for the asset class improved from those looking to hedge the impact of higher rates as well as reinvigorated demand from CLO issuance (ICE BofA, High Yield Indices, Bloomberg & Credit Suisse Leveraged Loan Index).
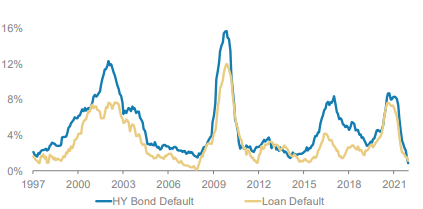
Fundamentals for high yield issuers fell to pre-pandemic levels with leverage improving to around 4x Debt/EBITDA while interest coverage improved to around 4x (Muzinich). Liquidity continued to improve as cash on the balance sheet improved to levels not seen since the Global Financial Crisis. Given the improvement in fundamentals, the annualized default rate declined to less than 1% which is well below long-term averages of closer to 3.5%. In addition, the highest rated BB rated issuers improved to 53% of the High Yield market which is the highest level in 20 years. In contrast, CCC quality issuers fell to only 11% of the market which is also a multi decade low (Muzinich). With that fundamental backdrop along with a manageable maturity profile, we expect defaults to remain benign.
We expect technicals to be favorable in the coming year as demand for higher yielding instruments should persist while new issue supply is expected to be lower than 2021. The US High Yield market is expected to shrink as ratings actions are likely to result in several issuers exiting the index as they are upgraded to investment grade. While valuations appear tight with credit spreads remaining below the long-term averages, the coupon carry and price improvements from upgrades should be constructive for returns.
Income has historically been the largest component of total return for High Yield over time as the additional carry can help offset any short-term price moves. Outside of any unforeseen geopolitical events, we expect High Yield bonds to provide returns in the range of 4-5% in the upcoming year. Loans have the potential for higher returns given the discounted dollar price and floating rate coupons which could be additive to returns during the expected Fed rate hikes. Accordingly, we expect returns for syndicated loans of between 4.5-5.5%. AAM continues to believe an allocation to both of these asset classes is best achieved with an actively managed approach and disciplined underwriting process that attempts to avoid defaults.
Exhibit 8: US High Yield Bond and Loan Default Rates
Convertible Securities
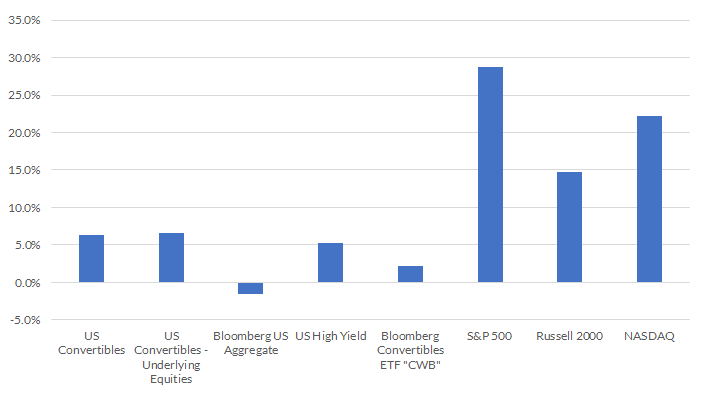
Domestic economic and capital market conditions provided a favorable backdrop for investors in risk assets during 2021, contributing to strong equity and credit market total returns. US Convertibles benefited from these market forces and delivered positive total returns for the year. Beneath the surface, however, diverging equity sub-sector returns and incredible levels of single stock volatility benefited active management within the convertible market in 2021. This may again be rewarded in 2022, particularly if recently turbulent waters continue.
Exhibit 9: 2021 Total Return – By Market Sector
Primary market issuance slowed last year relative to 2020, but remained strong with approximately $85B of gross supply pricing, according to Bank of America research. Peak convertible valuations early in the year led issuance to be front loaded with nearly half of 2021 supply pricing in the 1st quarter. While technology sector issuers continue to represent the largest segment of supply, nearly 70% of deal volumes were from other segments (BofAML). We believe these supply dynamics, coupled with declining prices among certain equity sensitive issues, have led to an increase in the balanced region of the US Convertible market and an improvement in overall breadth.
Exhibit 10: U.S. Convertible Market – Equity Sensitivity
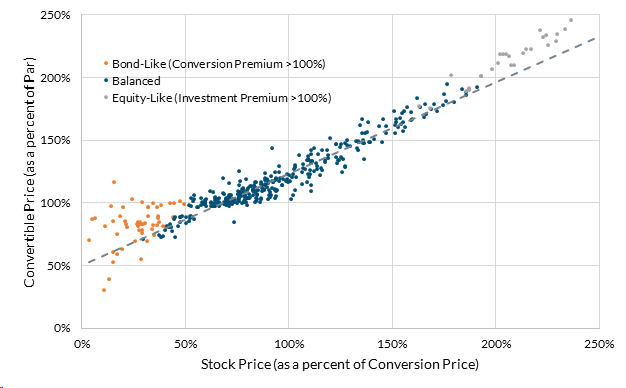
Concentration risks and equity sensitivity have improved in the convertible market in recent quarters, but these conditions remain a factor within indices and the strategies that track them. Active management in balanced convertibles, employing rebalancing tactics and embedding diversification principles, is likely to be a source of value for investors in the sector.
AAM expects elevated volatility will continue as we move through 2022 as fiscal support wanes and the Federal Reserve tightens policy to combat inflation. With equity markets trading lower in these early weeks of 2022, we are witnessing a staggering level of intra-day and single-stock volatility. We have observed that stable issuer credit profiles have supported balanced convertibles to the downside thus far and help preserve capital against falling equity prices. Ultimately, should share prices rebound, we believe balanced convertibles offer meaningful upside capture and are likely to significantly outperform investment grade, fixed income alternatives.
Disclaimer: Asset Allocation & Management Company, LLC (AAM) is an investment adviser registered with the Securities and Exchange Commission, specializing in fixed-income asset management services for insurance companies. Registration does not imply a certain level of skill or training. This information was developed using publicly available information, internally developed data and outside sources believed to be reliable. While all reasonable care has been taken to ensure that the facts stated and the opinions given are accurate, complete and reasonable, liability is expressly disclaimed by AAM and any affiliates (collectively known as “AAM”), and their representative officers and employees. This report has been prepared for informational purposes only and does not purport to represent a complete analysis of any security, company or industry discussed. Any opinions and/or recommendations expressed are subject to change without notice and should be considered only as part of a diversified portfolio. Any opinions and statements contained herein of financial market trends based on market conditions constitute our judgment. This material may contain projections or other forward-looking statements regarding future events, targets or expectations, and is only current as of the date indicated. There is no assurance that such events or targets will be achieved, and may be significantly different than that discussed here. The information presented, including any statements concerning financial market trends, is based on current market conditions, which will fluctuate and may be superseded by subsequent market events or for other reasons. Although the assumptions underlying the forward-looking statements that may be contained herein are believed to be reasonable they can be affected by inaccurate assumptions or by known or unknown risks and uncertainties. AAM assumes no duty to provide updates to any analysis contained herein. A complete list of investment recommendations made during the past year is available upon request. Past performance is not an indication of future returns. This information is distributed to recipients including AAM, any of which may have acted on the basis of the information, or may have an ownership interest in securities to which the information relates. It may also be distributed to clients of AAM, as well as to other recipients with whom no such client relationship exists. Providing this information does not, in and of itself, constitute a recommendation by AAM, nor does it imply that the purchase or sale of any security is suitable for the recipient. Investing in the bond market is subject to certain risks including market, interest-rate, issuer, credit, inflation, liquidity, valuation, volatility, prepayment and extension. No part of this material may be reproduced in any form, or referred to in any other publication, without express written permission.