Economic Outlook – Marco Bravo, CFA | Senior Portfolio Manager
Market Outlook – Reed Nuttall, CFA | Chief Investment Officer
Corporate Credit – Elizabeth Henderson, CFA | Director of Corporate Credit
Structured Products – Scott Edwards, CFA | Director of Structured Products
Municipal Market – Gregory Bell, CFA, CPA | Director of Municipal Bonds
High Yield – Patryk Carwinski, CFA | Portfolio Manager
Convertibles – Tim Senechalle, CFA | Senior Portfolio Manager
Equities – Peter Wirtala, CFA | Insurance Strategist
Economic Outlook
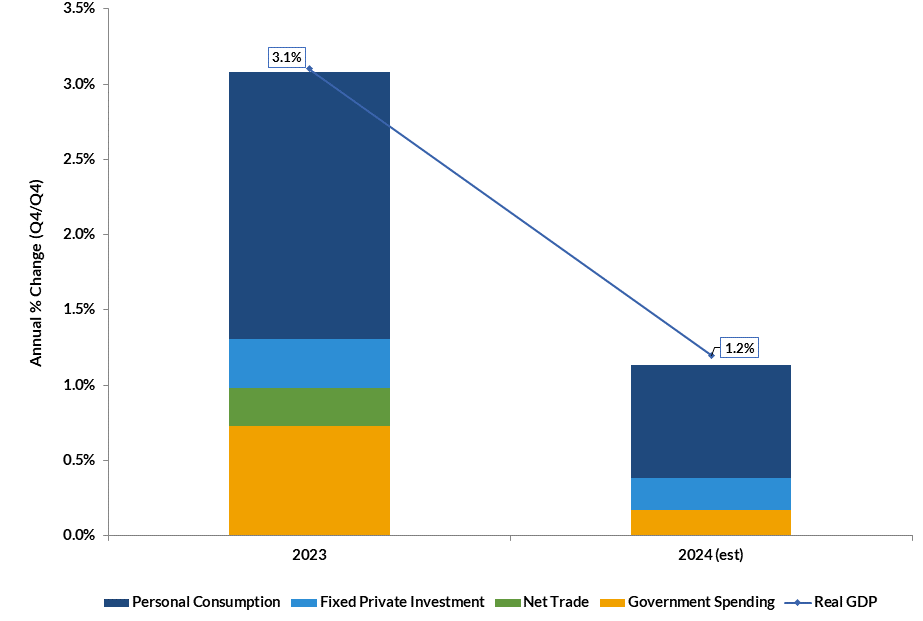
“The recession that never was” can best describe the economic environment of 2023. At the start of last year, the 2023 consensus forecast for real Gross Domestic Product (GDP) growth was 0.1% (q4/q4)1. Based on the most recent reading for Q4 GDP, economic growth last year came in at a much stronger 3.1% (q4/q4)2. Economic forecasters, including AAM, were expecting the rise in interest rates to reduce both consumption and investment but misjudged the resiliency of the U.S. consumer. For 2024, the consensus forecast still believes the impact of higher rates has yet to be fully realized. GDP growth this year is expected to slow to 1.2%3 (see exhibit 1). Offsetting the higher rates is a healthy labor market and rising wages which should continue to support consumer spending, the main contributor to economic growth. On the corporate side, balance sheets remain in a strong position and earnings growth will be supportive for fixed investment. AAM views the risks to GDP growth as balanced with our base case calling for below-trend but positive growth. Growth has the potential to surprise again to the upside as the Fed is expected to begin lowering rates this year.
Exhibit 1: Contribution to GDP Growth
If and by how much the Fed lowers rates this year will depend largely on inflation returning to the Fed’s 2% target. The Consumer Price Index (CPI) in 2023 increased by 3.4%4 on a year-over-year basis. Core CPI, which excludes the more volatile food and energy sectors and more closely watched by the Fed, was up 3.9%5 for 2023. Although inflation is expected to continue trending lower in 2024, we believe rising wages is a key upside risk to inflation, particularly within the services related industries. As such AAM views the risks to inflation as skewed to the upside and expects it will remain above consensus and above the Fed’s target.
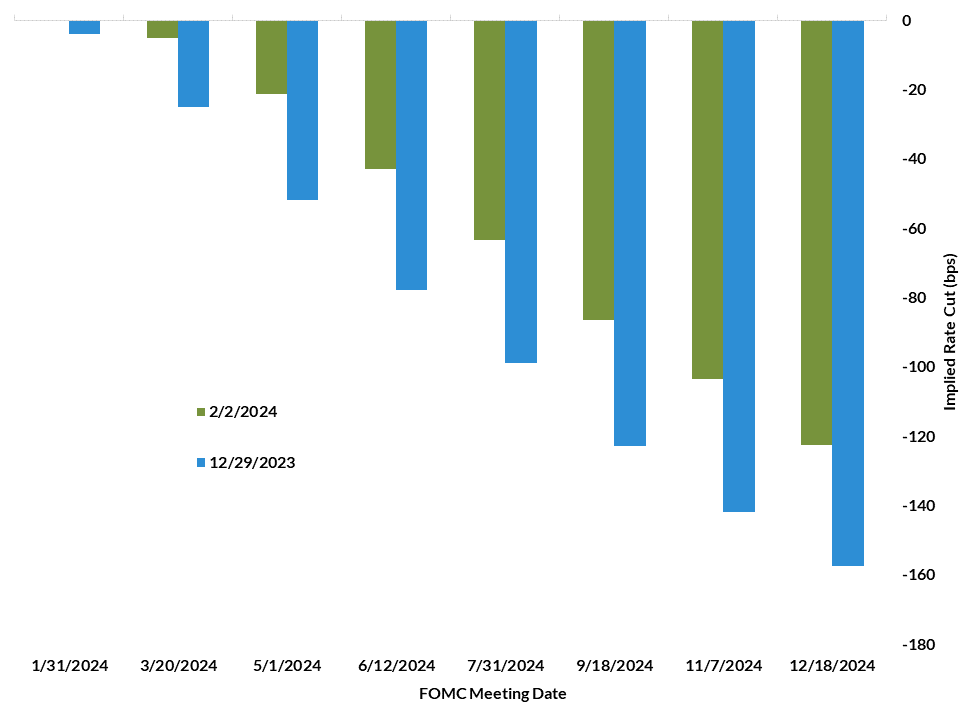
The market began 2024 with a very aggressive expectation of 150 to 175 basis points of cumulative rate cuts for the year6. Since the start of the year, the market has lowered its forecast for rate cuts due to better than expected economic data and a Federal Reserve that wants “greater confidence that inflation is moving sustainably towards 2%”7 (see exhibit 2). AAM’s base case is for 100 basis points of rate cuts in 2024.
Exhibit 2: Fed Funds Futures Market Implied Rate Cuts
With inflation trending lower and the Fed expected to cut rates, yields on US Treasuries are projected to decline in 2024 with the benchmark 10-year Treasury yield forecasted to average 3.9%8 in Q4 2024. The yield curve (2s vs 10s) is expected to steepen (less inverted) as the rate cuts from the Fed pulls short-term Treasury yields lower. AAM’s view on Treasury yields is in line with the consensus forecast of lower yields and a steeper yield curve. We expect the 10-year Treasury yield to end the year in a range of 3.50% to 4.00%.
Market Outlook
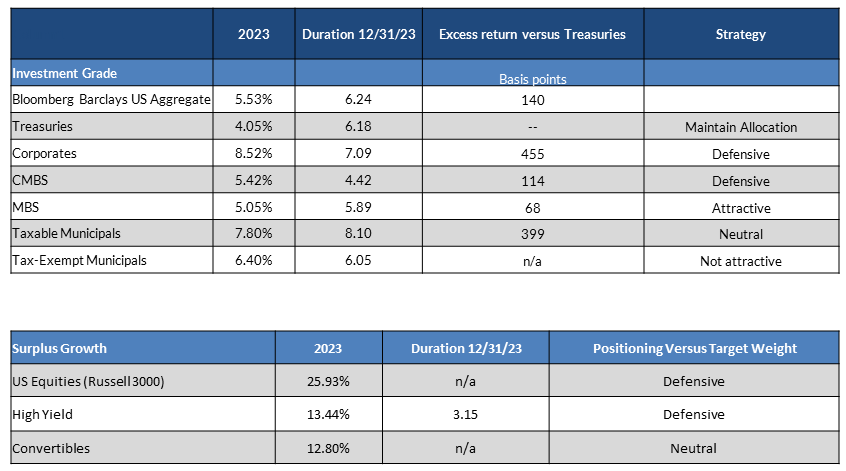
Exhibit 3: Asset Class Returns
2023 Recap
On March 10, 2023, Silicon Valley Bank failed after a short-lived run on the bank, resulting in the third largest bank failure in history. Bond investors were forced to scramble and began to scrutinize their holdings, looking for the next blowup. The consequent fear in the market drove Treasury yields lower and credit spreads wider. This environment provided a number of opportunities for investors with experienced, disciplined analysts in the corporate and MBS sectors. The volatility in March 2023 set the stage for terrific performance for the remainder of the year as spreads on the overall corporate market tightened by well over 50 basis points from the March-wides into year-end.
2024 Strategy
Spreads are tight across the investment grade bond universe. When spreads are tight, it’s important to reduce risk, build liquidity and focus on individual holdings where volatility may exist. Although we do not expect another round of bank failures in the coming months, we are working to get the portfolios prepared for an unknown “black swan” type event. This means we advocate trimming corporate allocations, adding to low-volatility Agency CMBS, and being opportunistic in adding to our Agency MBS positions. Our focus is on maximizing income to our clients. We have found the best way to achieve our goal is to not chase extra yield in risky bonds when the overall market is expensive but rather save that liquidity for a day in which it’s possible to add high quality bonds at attractive prices.
Corporate Bonds
AAM’s economic outlook is constructive for risk assets like Corporate Bonds, but as we have seen in 2023, sentiment can change very quickly. While not our base case, a hard landing remains possible. Therefore, we are watching for signs such as a rapidly deteriorating consumer, job losses in sectors in which we are not expecting, issues in the finance/banking sectors, and lower inventory order rates. That said, our base case reflects a soft landing; hence, we expect the OAS to remain in a tight range of 90 to 120 basis points in 2024. Given tight credit spreads, we are looking for value in sectors that still look attractive. We believe ‘BBB’ rated bonds have more room to compress vs. single-As. This is not only the case in Finance and Utilities but also in some Industrial sectors as well. At a broad sector level, we favor intermediate and shorter Financials, BBB-rated Industrials, and Utilities (Exhibit 4). We prefer the new issue market given trading costs and new issue concessions, especially when looking further out the curve. We expect to see opportunities in the new issue market related to mergers and acquisitions (M&A) in the less cyclical industries like Pharmaceuticals, Technology, and Food & Beverage.
At a more micro level, we expect consumers to spend at a lower rate than they did in 2023, but we do not see emerging problems with the consumer outside of some deterioration at the sub-prime level. We expect government programs to remain supportive for various industries and inventory de-stocking to be largely behind us. Excluding financial companies, we are forecasting revenue growth in the mid-single digit range and EBITDA to grow at a faster rate than revenues in 2024, allowing margins to expand after years of contraction. However, we expect EBITDA interest coverage to continue to fall as interest rates remain elevated, and we expect debt leverage to increase in consumer-related sectors, among others. After suppressed activity, we expect companies to pursue M&A in 2024, and we believe more cash flow will be spent on buying back shares. Importantly, although we expect fundamentals to weaken in 2024, we do not expect significant credit rating action which would result in spread widening for the market.
In the Finance sector, we expect late cycle trends to emerge whereby banks increase provisions for bad loans and margins remain challenged as it takes some time for the curve to normalize. Issuers that have been challenged in this rate environment like REITS and regional banks will need to access the market to refinance debt at a time of continued uncertainty, providing an opportunity to invest selectively. Finally, while we expect most finance companies to continue to work with borrowers to restructure loans with ample funds on the sidelines, we do not expect this to be without its challenges. The Finance sector is expected to remain a primary area of risk in the market in 2024, trading wider than it has historically vs. Industrials.
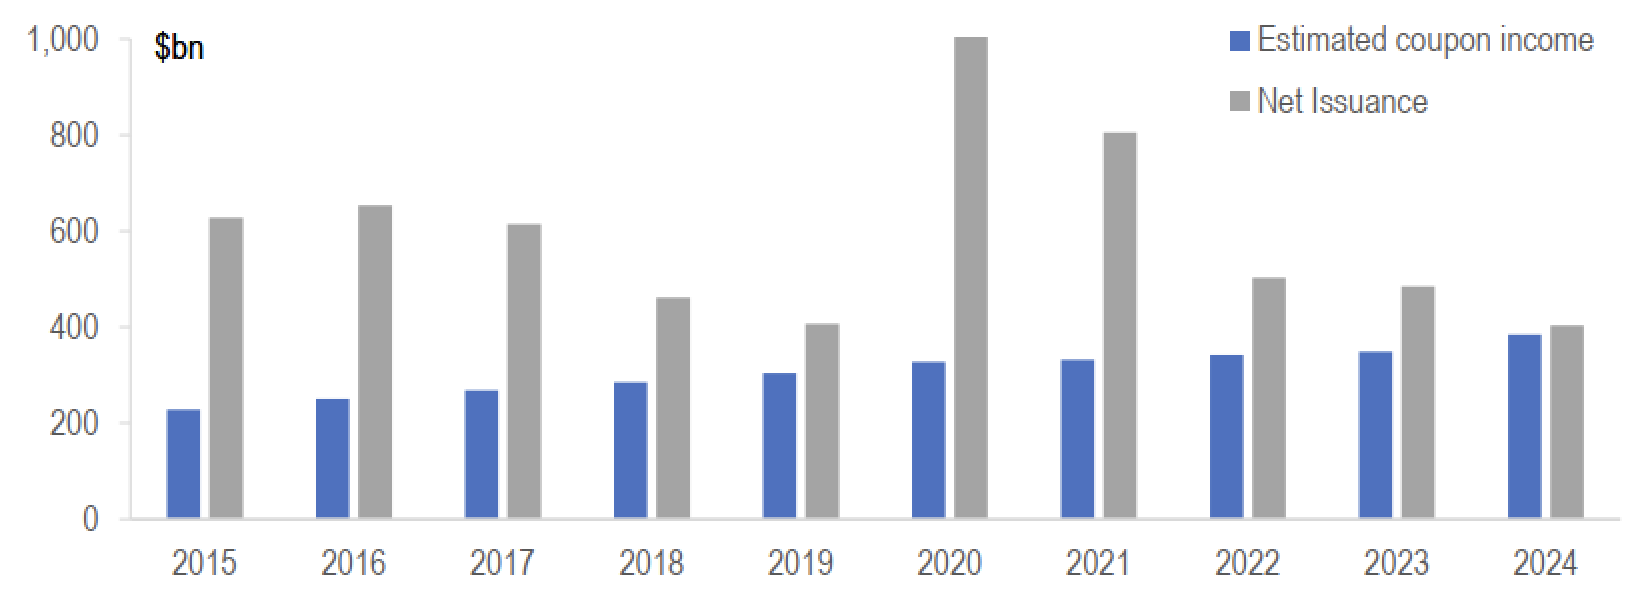
The strong demand for yield and lack of new debt supply has driven spreads for the 30-year part of the curve to historic minimums. Typically, an investor would want more spread to compensate for the longer duration. But in 2023, this 10s-30s9 credit curve inverted. Our expectation is for this to start to normalize; therefore, we prefer the intermediate part of the maturity curve. But we expect technical support for the long end will continue due to the lack of long duration yield in other markets. Notably, this year we expect coupon income to approximate net debt issuance, which is a strong technical positive. We believe the continued demand for yield and lower level of net supply (Exhibit 5) especially in the long end will remain a primary source of support for spreads.
Exhibit 4: Performance Expectations by Sector for 2024
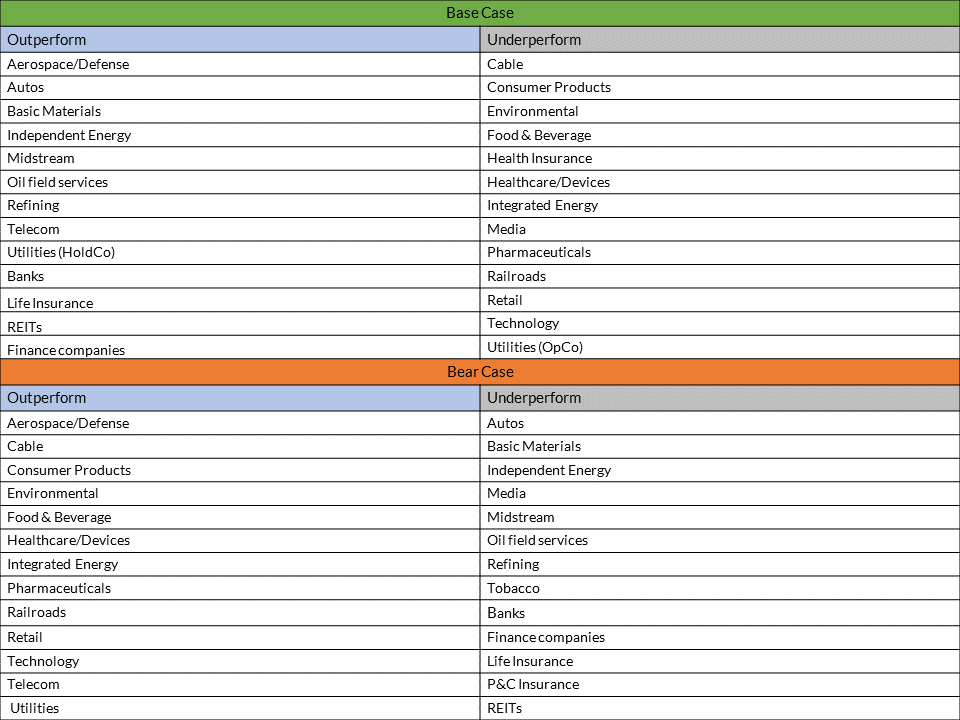
Exhibit 5: Investment Grade Corporate Bonds – Coupon Income Compared to Net Issuance
Structured Products
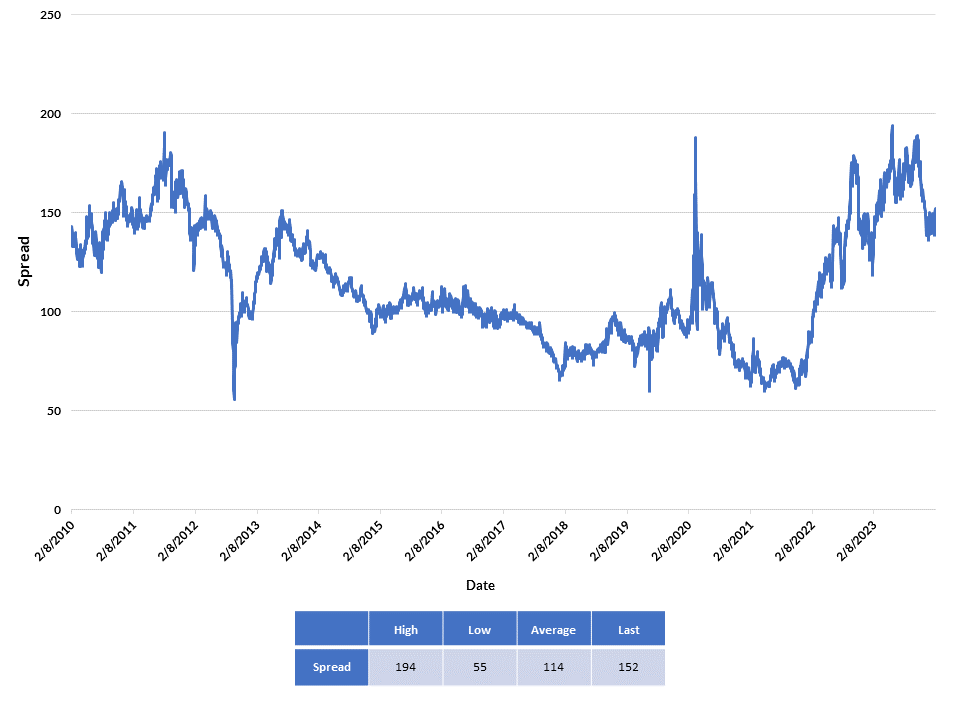
Structured products performed well in 2023 generating higher returns than Treasuries and other lower risk assets. As we enter 2024, spread levels look relatively attractive in most sub-sectors and we anticipate another year of competitive returns vs. other risk sectors. Agency mortgage pass-throughs hold the most promise as yield spreads remain near multiple year highs. In Exhibit 6, we show the yield spread of new issue mortgage backed securities to Treasuries over the past 14 years. With the Fed switching from Quantitative Easing to Quantitative Tightening, spreads have repriced to reflect the shift from a non-price sensitive buyer in the Federal Reserve to very price sensitive buyers in Money Managers and large domestic banks. Although spreads have narrowed from the 194bp level this past year, they still provide plenty of yield when compared to their longer-term average as well as to high quality corporate bonds. While not our base case, should the economy experience a hard landing, Agency MBS provide the added protection of an implied government guarantee and serve as a lower risk, shock absorber within a portfolio should risk asset spreads widen materially.
Exhibit 6: Fannie 30yr Current Coupon Mortgage Spread
One sub-sector requiring particular scrutiny in the coming year is the CMBS market, specifically managing the evolving risk with regard to office exposure. Yield spreads for both conduit and single property securitizations narrowed fairly dramatically during the 4th quarter last year, leaving the market fairly valued relative to corporate bonds but leaving no extra yield premium given the prospect for more headline risk related to office exposure. We view the mostly likely path forward is that the office market will evolve much like the regional mall market has over the past 5 year. Well positioned properties, in stable and growing markets will survive and even thrive while poorly situated B and C quality properties will suffer with occasional headline grabbing results.
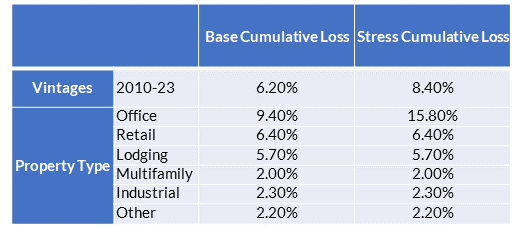
This doesn’t necessarily spell disaster for conduit or single property structured securities. JP Morgan recently completed a detailed analysis of the underlying collateral of the entire conduit universe. A portion of those results are summarized in Exhibit 7. They project office properties in the conduit universe to realize losses of 15.8% in their stress case scenario which assumes a 30% drop in occupancy rates and rising market level cap rates. When applied to a diversified pool of conduit loans, securitization total losses are projected to hit 8.40% on average. While there will certainly be a divergence in actual experience around those numbers, these types of losses will not impair recovery of principal in more highly rated tranches. Similar scenarios can be constructed for single office building securitizations. Low leverage and conservative underwriting lead to a similar conclusion that forecast losses are manageable in senior and most investment grade tranches. Careful analysis will be required to identify the best transactions.
Exhibit 7
Municipal Market
After a very volatile year, in which an elevated rate environment contributed to wide swings in spreads across both the tax-exempt and taxable muni markets, we enter 2024 with a more constructive view on technicals. As the Federal Reserve turns to a less-hawkish stance on monetary policy and potentially targets rate cuts later in the year, we expect demand for both sectors to continue their positive momentum from the last half of 2023.
For the tax-exempt sector, the market has witnessed a significant rally in 10yr rates since they reached their peak of 3.61% on November 1st. Strong demand resulting from very heavy reinvestment flows of coupons/calls/maturities, combined with a substantial Treasury rally, helped push 10yr yields lower by 96 basis points (bps) over the last two months of 2023. Broader-based relative valuation metrics like 10yr muni-to-Treasury ratios would collapse from 75% at the beginning of November and end the year at a very expensive 58%10. Although we remain constructive on overall new issue supply in the new year, with a modest increase of 7% to $409 Billion, the very expensive relative valuation levels for the sector are not sustainable, in our opinion. For insurance company portfolios, we find a much better total return proposition in taxable alternatives, including taxable municipals. Entering 2024, ‘AAA’ 10yr taxable munis provided a yield advantage of a very compelling 176bps versus similarly rated 10yr tax-exempts on a tax-adjusted basis at the 21% corporate tax rate11.
In looking at the taxable muni sector, we have a more constructive view on the market. The sector has also witnessed very strong performance over the course of last year. Yield spreads to Treasuries would reach their widest levels in mid-March after weaker technicals and liquidity pressures pushed 10yr spreads to 106bps. Since that point, spreads have contracted sharply as falling Treasury rates in the fourth quarter, combined with a very muted new issuance calendar and solid underlying credit fundamentals, resulted in spreads tightening by 45bps to end the year at 61bps12. In our opinion, relative valuation levels for the sector now appear to be more fair value and we do not have a strong conviction for spreads to move meaningfully tighter in 2024. However, technicals are expected to remain supportive of the current spread levels. New issue supply is expected to see a modest increase of 14% to $45 Billion. The elevated rate environment is expected to both suppress the financing for new money projects in the taxable sector, and also continue to make refinancings uneconomical13. The sector should also continue to see support from underlying fundamentals. Although state revenues have moderated over the last year to a .9% growth rate in fiscal 2023, and are expected to see a modest decline of 1.8% for fiscal 2024, these levels are off a very high base of double-digit growth levels in fiscal years 2021 and 2022. These revenue increases have resulted in record total balances levels in fiscal 2023 to realize an aggregate of $406.9 Billion. Although expectations are for these reserve levels to fall to $288 Billion for fiscal 2024 on weaker revenue growth and higher spending levels, this number is viewed as a very healthy level for fiscal stability and budget flexibility going into a potentially slowing economy in 202414.
Exhibit 8: Tax-Exempt Relative Valuation Levels Remain Unattractive for Insurers
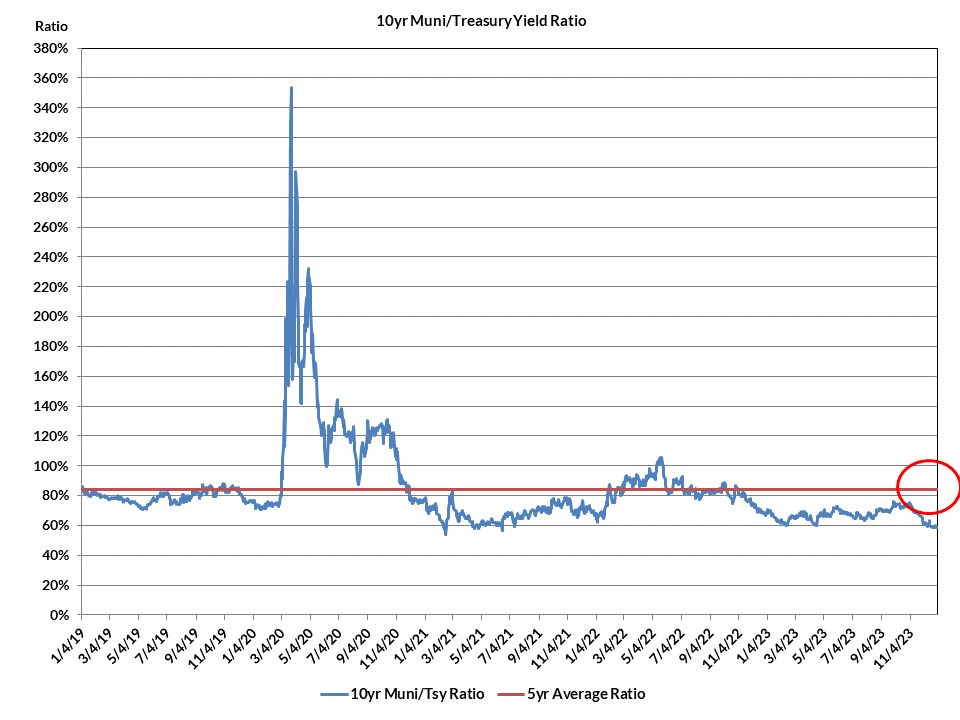
Exhibit 9: Taxable Munis: Compelling Alternative to Tax-Exempts
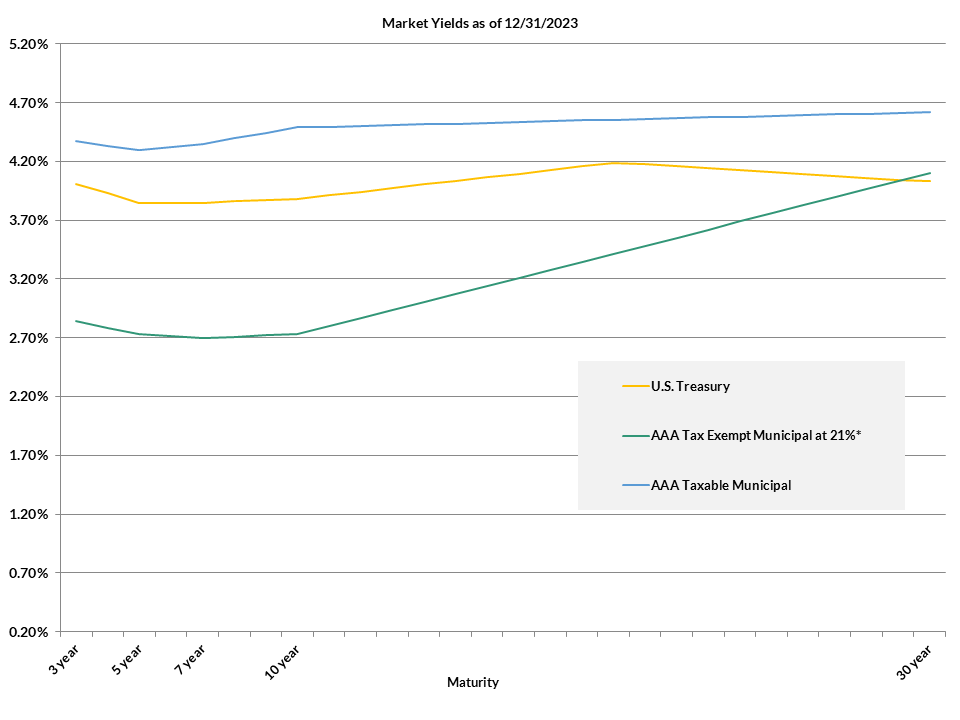
*21% Corp Rate Tax-Adjusted at a Factor of 1.1994
High Yield and Leveraged Loans
After a stellar 2023 when high yield bonds returned 13.5%15 and bank loans returned 13.0%16, the outlook for 2024 is a bit more subdued, albeit still positive. With a yield-to-worst of 7.4%17 for bonds and 8.4% for loans, carry is expected to be the dominant driver of performance in high yield for the year.
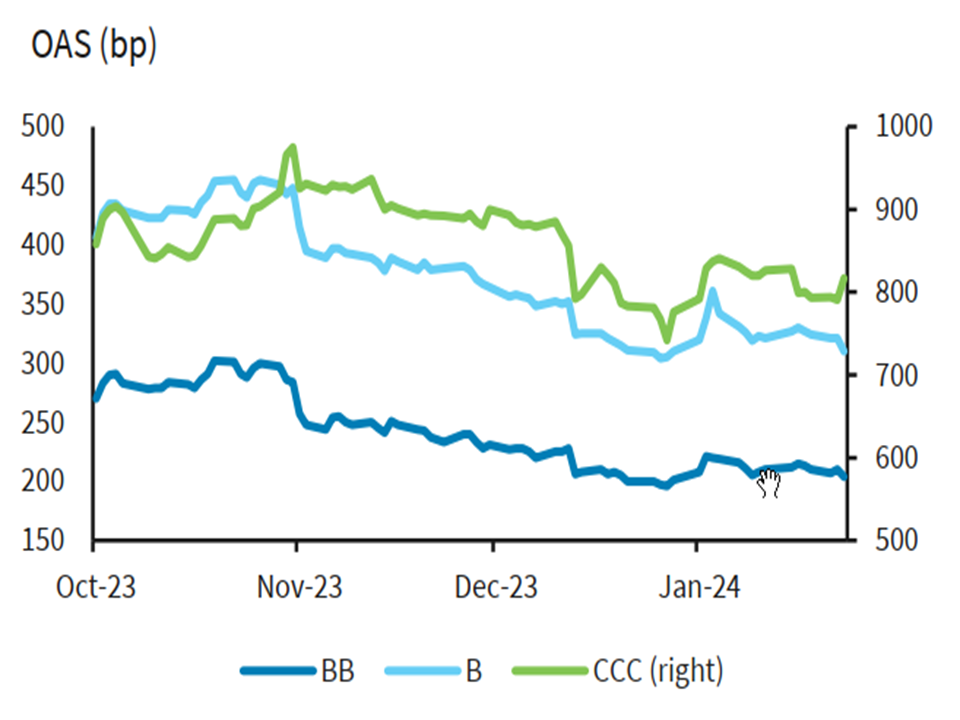
Spreads have moved inside of historical averages, making the asset class less attractive today. Should economic conditions remain benign, spreads are expected to stay within historical levels. Company balance sheets remain stronger versus other cycles, albeit more levered issuers face the likelihood of debt service eroding cash flows as high rates persist. Such issues will be more common in the CCC-rated space and are generally well telegraphed. Managers employing credit discipline with a focus on higher quality BB/B issuers should benefit in an environment where credit defaults are expected to rise gradually towards long-term averages.
Leveraged loans continue to be attractive given higher average coupons, but that dynamic may shift as the Fed begins moderating rates later this year. Bonds, on the other hand, continue to benefit from a pull-to-par. Net supply in loans has started out the year strong, but is expected to contract for the year overall given bank-for-loan takeout activity and borrower shift towards private credit. Significant issuance in bonds (and to a degree in loans) is expected to be driven by refinancing activity as issuers face a large maturity wall.
Exhibit 10: Maturities Over the Next Two Years
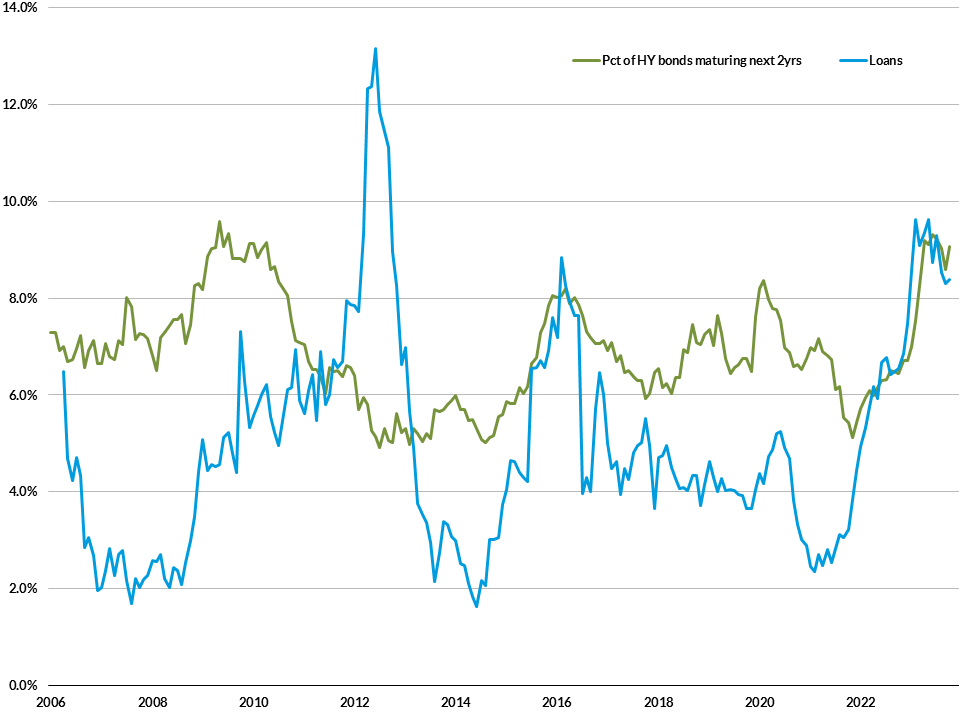
Exhibit 11: High Yield Spreads
Convertible Securities
The strong economy and conclusion to the Fed’s rate hiking cycle fueled a rally in risk assets last year. Mega-cap technology shares posted massive gains and helped to drive overall equity markets to new highs, reversing losses from 2022. Convertible bonds, which derive performance from a blend of bond and stock inputs, participated in the rally with the Bloomberg US Balanced Convertible Index returning 12.8% (underlying stocks +17.7%) for the year18.
Performance dispersion within the market was driven primarily by industry exposure and market capitalization rather than curve positioning. According to Bank of America Global research, utility (-5.3%) and transport (-2.8%) sector convertibles posted negative returns, dramatically underperforming technology (+20.2%) and consumer discretionary (+23.4%) sector convertibles. Notably, utility issuers were a significant issuer into the convertible market during the year.
Convertible returns in 2024 will ultimately hinge on performance in U.S. stock markets and the breadth of such gains. A repeat of 2023 appears unlikely, given current valuations. However, downside risks for convertible investors have declined relative to recent years as a result of three factors. 1) Higher coupons raise static and downside scenario returns. Bloomberg’s US Balanced Convertible Index yield has increased by 100 basis points since 12/31/2021 and has prompted improved deal terms for convertible investors. Exhibit 12 below illustrates the improved new issue terms in recent quarters, as average coupons of 3.0%-3.5% have doubled since the 2020-2021 supply blitz, and conversion premiums have returned to historical averages.
Exhibit 12: U.S. Convertible Market – Historical New Issue Characteristics
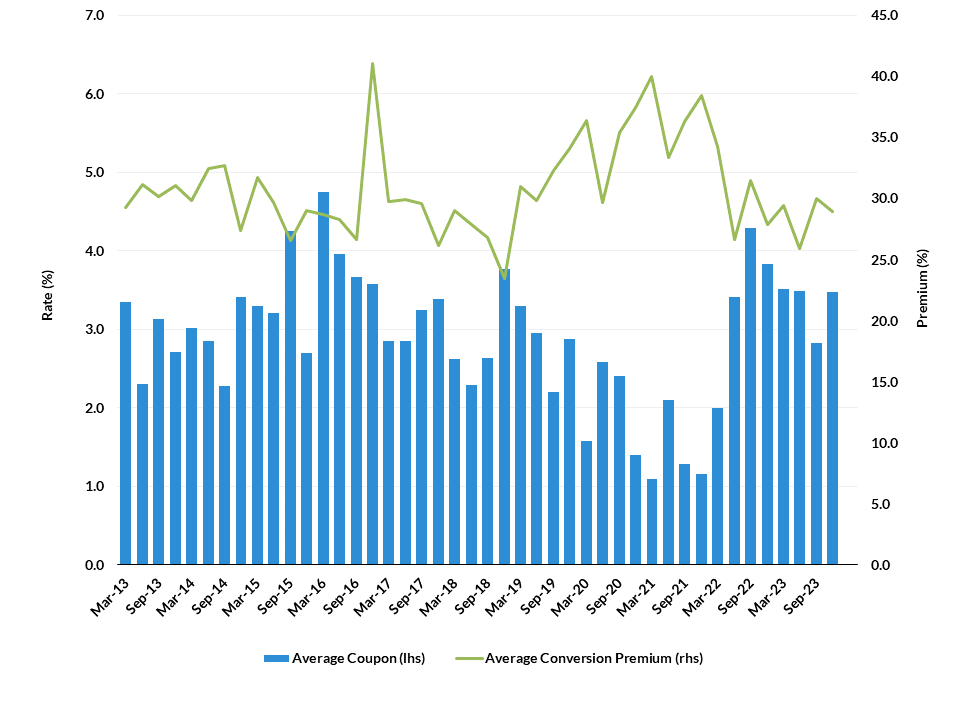
2) Equity sensitive convertibles represent minority of the U.S. Convertible market19. Absent volatility in rates/spreads, balanced and bond-like convertibles, with their reduced delta sensitivities, will dampen the return for the overall convertible market. 3) New issuance is expected to increase due as refinancing needs draw near for the 2025/2026 maturity wall in convertibles and straight debt markets. An increase in the volume of par priced issues, with balanced attributes, will offer investors opportunities to maintain optimized asymmetry in risk/reward.
Equities
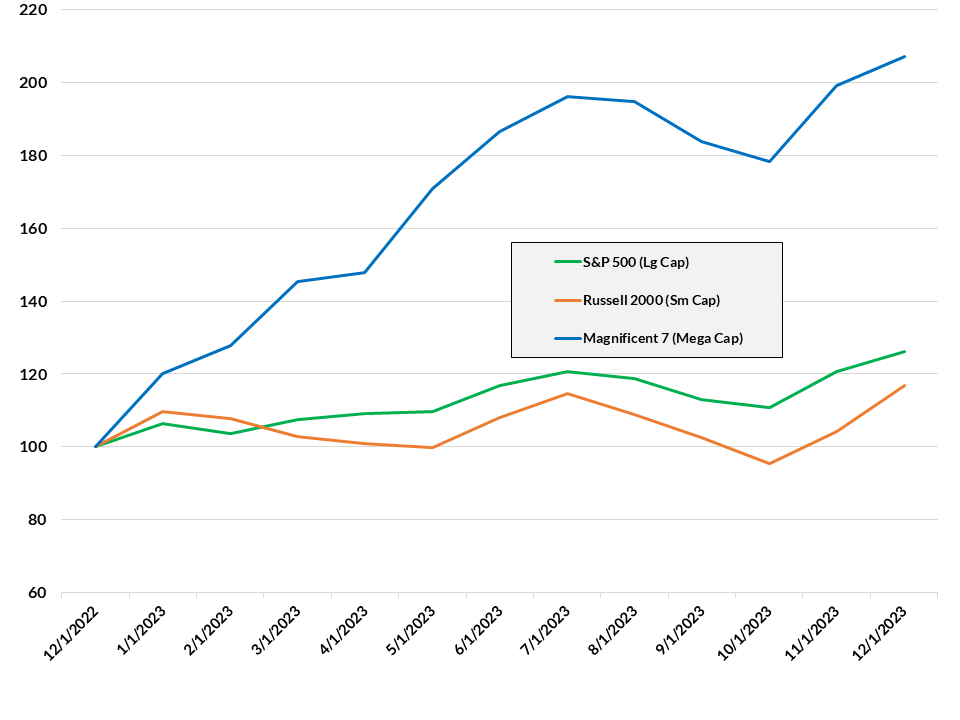
US equities delivered strong returns in 2023, with the broad Russell 3000 index up 25.9% for the year20. Two of the most important themes driving markets for the period were growing optimism about the potential for an economic “soft landing” from last year’s inflation surge, and the extremely strong performance of a handful of mega-cap Tech stocks (dubbed the “Magnificent Seven”), in large part due to breakthroughs in generative large-language models (LLM’s). While portions of the year saw pullbacks associated with concern about the strength of the banking system, a potential resurgence of inflation, rising geopolitical risks, and the US government’s chaotic fiscal situation, these were ultimately trumped by the expectation of rate cuts and other accommodative measures from the Federal Reserve coming in 2024. While earnings have generally been robust with strong consumer spending supporting the US economy, the mega-cap stocks that have recently driven index returns are priced at rich valuations, and could experience substantial volatility if profits disappoint estimates going forward.
Looking ahead to 2024, we expect these themes to carry forward, though possibly not in the same direction as last year. Any signs of returning inflation or hawkish rhetoric by the Fed could drain the “rate cut premium” from the market as swiftly as it inflated late last year, and investors will likely look for more clarity on how LLM’s will ultimately justify the run-up in prices among large Tech names, as hype gradually gets replaced with demand for revenue impact. With markets currently (in February 2024) above the prior all-time highs from 2021, valuations are at one of the highest levels on record. Still, turmoil in Europe and China has encouraged a steady international bid for the perceived safety of US assets, and the expectation that the Fed will soon re-open the liquidity taps and turn accommodative has kept investor sentiment bullish. Overall we believe a cautious tone is warranted this year, as rich valuations and numerous sources of potential headline risk (inflation, geopolitical conflict, further stress in the banking system, and a contentious election, to name a few) have created a narrow tightrope for markets to walk if they hope to repeat 2023’s strong performance.
Exhibit 13: Cumulative Equity Returns – 2023
1 Consensus Estimate from Blue Chip Financial Forecasts (Jan. 2023)
2 Bureau of Economic Analysis
3 Consensus Estimate from Blue Chip Financial Forecasts (Feb. 2024)
4 Bureau of Labor Statistics
5 Bureau of Labor Statistics
6 Bloomberg, Fed Funds Futures
7 FOMC January statement
8 Consensus Estimate from Blue Chip Financial Forecasts (Feb. 2024)
9 10s-30s refers to the difference in spread between 30-year maturities and 10-year
10 Bloomberg, Refinitive
11 Bloomberg, Refinitive, JP Morgan
12 AAM, Bloomberg, Refinitive, JP Morgan
13 Barclays, JP Morgan
14 NASBO
15 Bloomberg US Corporate High Yield Bond Index
16 Credit Suisse Leveraged Loan Total Return Index
17 Muzinich & Co.
18 Bloomberg L.P.
19 Barclays
20 Bloomberg


Corporate Fundamentals 2Q26; AI Debt Issuance Can’t Stop Won’t Stop
July 16, 2026