Interest rates have risen in 2022, but the hunt for yield by Life insurers remains as strong as ever. One asset class that’s received growing attention in recent quarters is private debt; as consolidation in the banking industry and regulatory changes limit funding options for small and medium-sized enterprises (SMEs), institutional investors have found attractive opportunities to lend to these companies through a variety of vehicles, one of the most convenient being through a Business Development Corporation (BDC). BDCs can be thought of as similar to REITs; whereas the latter are tax-advantaged vehicles for investing in real estate and related assets, BDCs are tax-advantaged vehicles for investing in private debt and related capital instruments of SMEs. BDCs can offer competitive yield profiles, built-in diversification, and much greater simplicity than direct investments in a portfolio of individual loans to SMEs.
BDCs can offer stable and attractive dividend distributions to equity investors given the predictable cashflow generation of the underlying securities, as well as distribution requirements to maintain favorable tax treatment. However, because they lend primarily to private SMEs, which can be more vulnerable to weaker economic conditions than larger corporations, cashflow generation could become impaired in the event of a recession. Additionally, underwriting quality can vary quite significantly among BDCs, placing an emphasis on manager selection in the investment decision-making process. Exposure to this asset class in insurance portfolios should also be measured carefully in relation to surplus. When BDCs are carried as equity, since the holdings are fundamentally debt, they can have less downside potential than true equity. Life insurers ordinarily carry little or no equity, and are generally right to do so. Equity must be marked to market, adding a lot of potential volatility to surplus, whereas high yield bonds can be carried at amortized cost. Equity also carries a much higher RBC charge than most other assets, and many Life insurers manage their RBC ratios carefully. We believe this investment pattern creates an interesting opportunity: due to nuances in the calculation of RBC, adding a modest position in BDC equity may actually improve the RBC ratio for an insurer with no other equity exposures, or at least (more likely) reduce it much less than a comparable addition to higher-risk fixed income investments.
Specifically, the “covariance adjustment” is a part of the RBC ratio calculation that reduces total required capital from the various risk factors (insurance risk, business risk, etc) to reflect that they are relatively unlikely to all suffer losses simultaneously. In this calculation equity and fixed income risks are separate. Due to the mechanics of the calculation, having one of the risk factors increase from 0 has a much smaller impact on the RBC ratio than adding additional required capital to a factor that’s already sizable. In other words, a Life insurer with no equity holdings that adds a position to BDC equity can likely see much less of an impact on RBC than if they’d added e.g. high yield bonds.
A quick example can illustrate this effect in action. Suppose a hypothetical Life insurer has the following RBC statistics at 12/31/21:
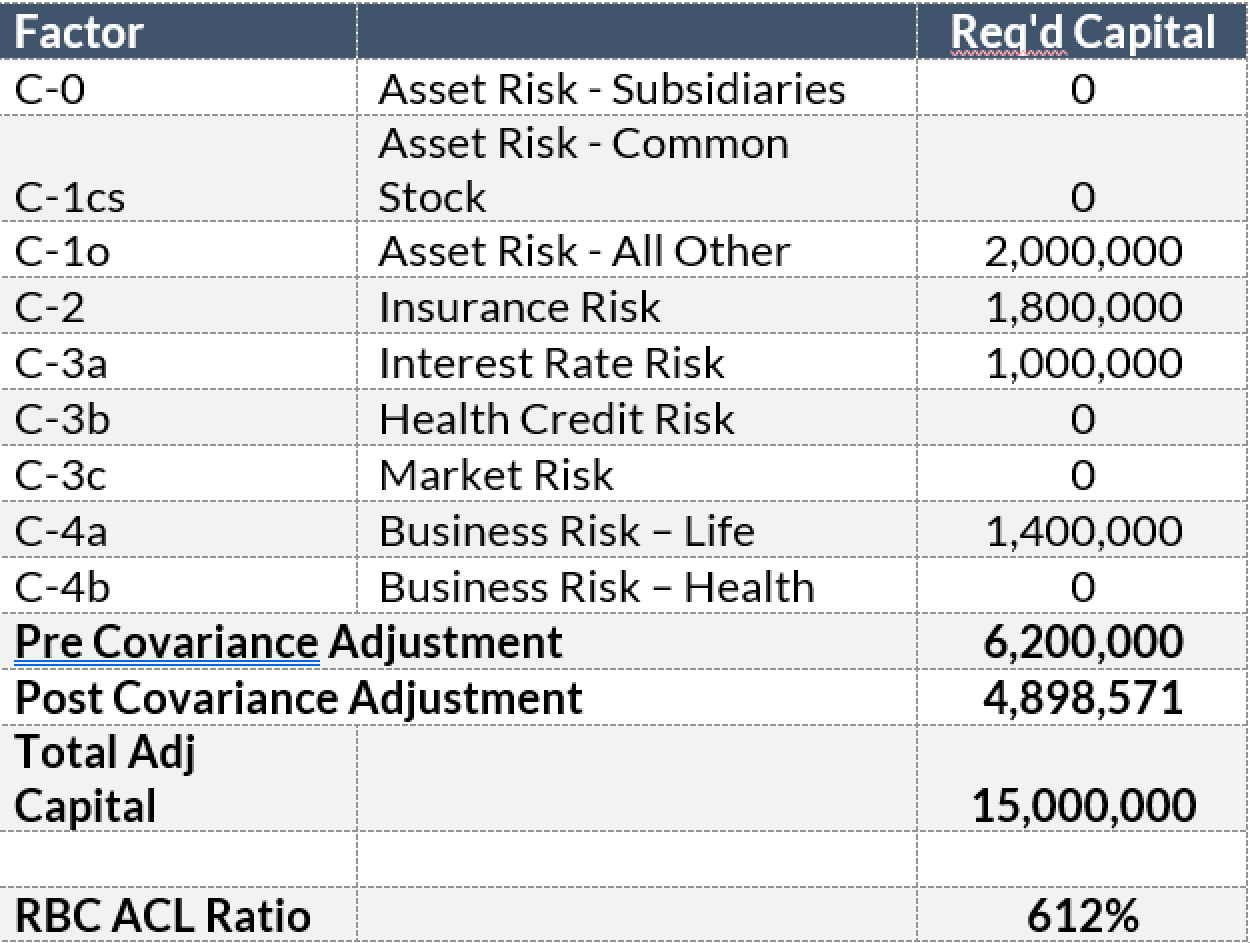
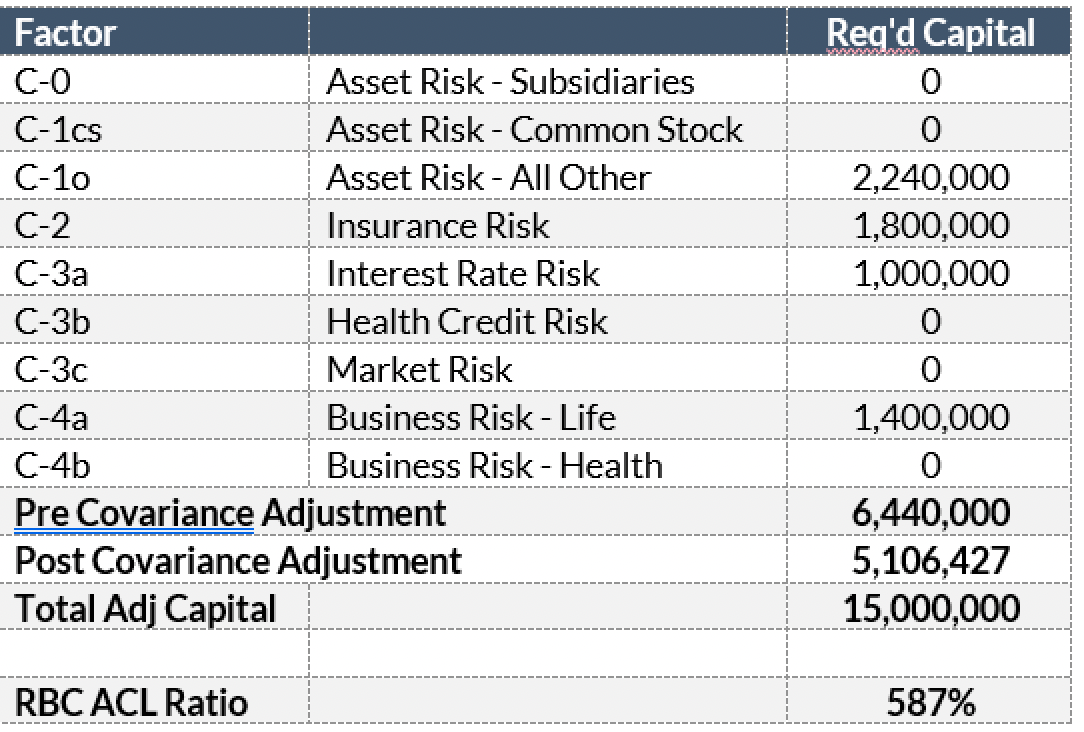
The relative sizes of the different factors above are typical for a Life insurer with around $200 million in invested assets. Now suppose this company has $4M in cash sitting on its balance sheet, and decides to invest it in high yield bonds with an average RBC charge of 6% (we will ignore the tax adjustment for simplicity’s sake, it doesn’t affect the point we’re trying to illustrate). Their RBC ratio falls 25 points to 587:
What if they had instead invested that $4 million in a BDC, carried as equity? Assuming a 22.5% factor the new calculation looks like this:
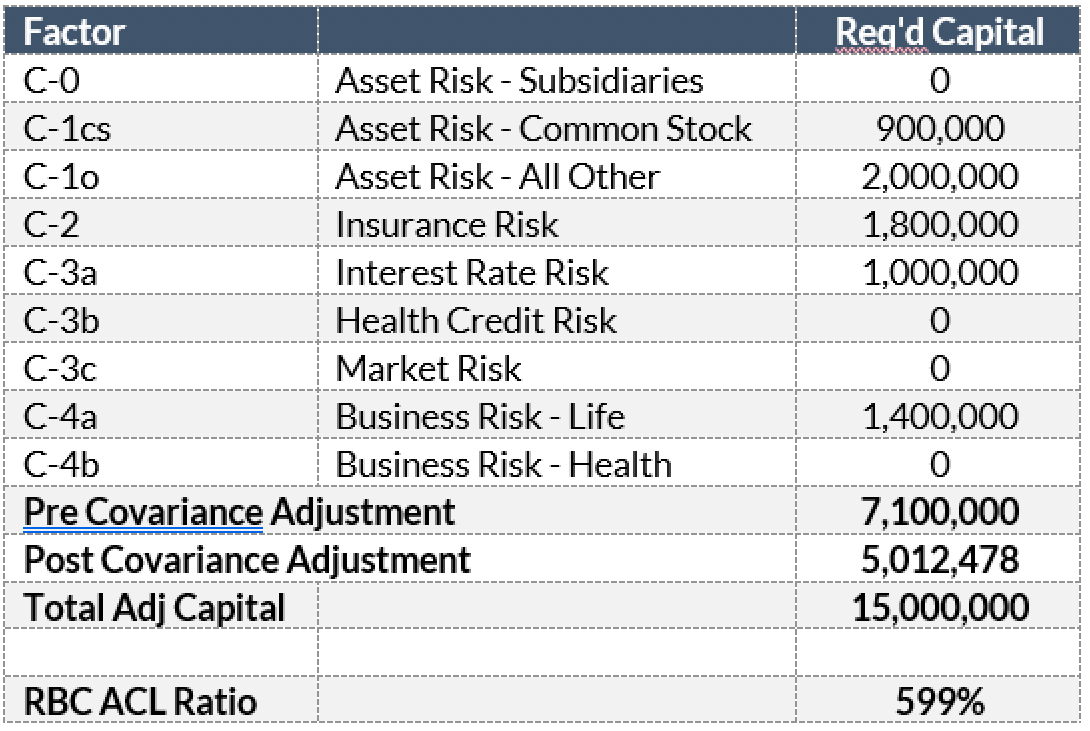
Despite adding an asset with nearly 4x as high a factor applied to it, the RBC ratio in this example only falls by about half as much! This is because the required capital is being added to the Asset Risk – Common Stock bucket, which was previously zero, rather than the Asset Risk – All Other bucket, which was already the largest one. That depicts the possible benefit that’s available from taking full advantage of the covariance adjustment. For Life insurers with little or no current equity exposure, this may be an opportunity worth exploring.
*The example shown is for illustrative purposes only and there’s no guarantee these results will occur.
Disclaimer: Asset Allocation & Management Company, LLC (AAM) is an investment adviser registered with the Securities and Exchange Commission, specializing in fixed-income asset management services for insurance companies. Registration does not imply a certain level of skill or training. This information was developed using publicly available information, internally developed data and outside sources believed to be reliable. While all reasonable care has been taken to ensure that the facts stated and the opinions given are accurate, complete and reasonable, liability is expressly disclaimed by AAM and any affiliates (collectively known as “AAM”), and their representative officers and employees. This report has been prepared for informational purposes only and does not purport to represent a complete analysis of any security, company or industry discussed. Any opinions and/or recommendations expressed are subject to change without notice and should be considered only as part of a diversified portfolio. Any opinions and statements contained herein of financial market trends based on market conditions constitute our judgment. This material may contain projections or other forward-looking statements regarding future events, targets or expectations, and is only current as of the date indicated. There is no assurance that such events or targets will be achieved, and may be significantly different than that discussed here. The information presented, including any statements concerning financial market trends, is based on current market conditions, which will fluctuate and may be superseded by subsequent market events or for other reasons. Although the assumptions underlying the forward-looking statements that may be contained herein are believed to be reasonable they can be affected by inaccurate assumptions or by known or unknown risks and uncertainties. AAM assumes no duty to provide updates to any analysis contained herein. A complete list of investment recommendations made during the past year is available upon request. Past performance is not an indication of future returns. This information is distributed to recipients including AAM, any of which may have acted on the basis of the information, or may have an ownership interest in securities to which the information relates. It may also be distributed to clients of AAM, as well as to other recipients with whom no such client relationship exists. Providing this information does not, in and of itself, constitute a recommendation by AAM, nor does it imply that the purchase or sale of any security is suitable for the recipient. Investing in the bond market is subject to certain risks including market, interest-rate, issuer, credit, inflation, liquidity, valuation, volatility, prepayment and extension. No part of this material may be reproduced in any form, or referred to in any other publication, without express written permission.