Commercial mortgage whole loans currently provide insurance investors with an attractive yield advantage to investment grade bond alternatives. Some of the features of the asset class for insurers include favorable risk based capital treatment, enhanced risk adjusted returns versus fixed income alternatives, and low correlation to other asset classes. The strong track record of this asset class, along with new loan terms and investment vehicles, warrants the attention of insurers of all types and sizes.
This paper will explore the value of commercial mortgage loans in an insurance company portfolio.
Privately placed first lien commercial mortgages, or commercial “whole loans,” have been a staple of U.S. insurance portfolios since the late 19th century. Insurance companies, and particularly life insurers, dominated the fixed rate whole loan market until the late 1980’s, when sloppy underwriting, bank deregulation, and excessive property valuations shook the market and resulted in insurers managing losses rather than growing whole loan portfolios. This released insurers’ stranglehold on new whole loan origination and, beginning in 1993, paved the way for investment bankers to seize market share and securitize private real estate debt in a new product – commercial mortgage backed securities (CMBS). This new entrant forced life insurance companies to learn from the self‐inflicted challenges of the late 1980’s and recalibrate their whole loan investment model to a more prudent, long‐term oriented approach.
The updated insurance whole loan lending model has focused on originating conservatively underwritten loans, secured by high quality assets and located in attractive markets. As such, delinquencies on loans originated by life insurance companies fell from a peak of 7.53% in 1992 to only 0.08% in the second quarter of 2013 (see Exhibit 1). In contrast, and as a result of CMBS lenders underwriting on unrealistic valuations, second quarter 2013 CMBS delinquency was 10.73%; falling into the same trap insurers experienced 20 years prior in the mid-1990’s.
Exhibit 1: Commercial Mortgage Delinquency Rates
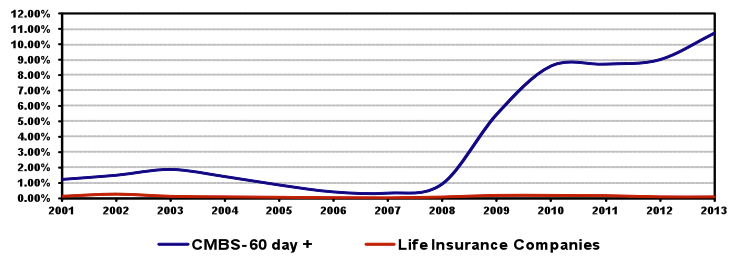
Source: CMBS data Barclays Capital as of June 30, 2013.
Note: Life Insurance Companies as reported by ACLI as of June 30, 2013. CMBS delinquency represents securitized loans delinquent for 60 days or longer. ACLI represents total commercial property loan delinquency rates for life insurance company portfolios.
Over the past two decades, the reconfigured life insurance whole loan model has become a lower‐risk, profitable and easily replicated framework for many insurance investors for three reasons: 1) the spread focus and asset/liability duration matching mitigates interest rate risk; 2) whole loans offer enhanced risk‐adjusted returns versus public market alternatives, and 3) privately originated whole loans provide structural benefits versus CMBS. Insurance companies can benefit from duration matching assets to liabilities with fixed spreads. This offers insurers an opportunity for accretive income return and a profit margin for insurers for the entire life of such liabilities, thereby limiting the effect of fluctuating interest rates. This feature of conservative whole loans is especially valuable in today’s historically low interest rate environment.
Falling rates have created an increasingly difficult conundrum for fixed income investors. Although this environment has produced strong total return, investors are faced with the challenge of reinvesting capital at historically low rates. It appears likely that portfolio level cash flow generation will remain low in the intermediate term, so over‐weighting asset classes offering superior current cash flow and attractive risk‐adjusted yields is crucial.
Exhibit 2
|
U.S. Fixed Income Yields (Approximately 7-7.5 year Mod. Duration) |
||||
| Asset | Yield (9/3013) | 10-Year Total Return (Annualized) (9/30/13) | 10-Year Standard Deviation (9/30/13) | Credit Spread (bps) (9/30/13) |
|
U.S. Treasury Notes (Barclays UST, 7-10 Years Index) |
2.36% | 5.30% | 6.58% | N/A |
|
Investment Grade Corporate Bonds (Barclays Corporate Bond Index) |
3.30% | 5.27% | 6.07% | 142 |
|
BBB Industrial Corporate Bonds (Barclays Corporate Bond Index) |
3.90% | 5.15%% | 6.60% | 115% |
| Commercial Mortgage Loans (2) | 4.72% | 5.21% | 4.24% | 236 |
Source: Barclays, Quadrant Real Estate Advisors.
Note: Commercial Mortgage Loans represent privately place whole loans (first mortgages). Total return and standard deviation calculations from the Giliberto-Levy index as of 6/30/2013. Commercial mortgage yields and spreads are based on market opportunities seen by Quadrant Real Estate Advisors. The yield represents the bond equivalent weighted spread across property types for 75% LTV loans.
As Exhibit 2 shows, U.S. private whole loans offer enhanced yields relative to public market alternatives. Whole loans also offer the following attributes:
- Superior call protection relative to corporate bonds
- Materially higher recoveries following default than both corporate bonds and CMBS
- Significantly lower volatility as measured by the standard deviation of quarterly total returns over the past 10 years
Structurally, whole loans offer particular advantages over CMBS for buy‐and‐hold investors. Private whole loans afford lenders more control in structuring loans and in realizing a recovery in the unlikely event of default; whereas CMBS investors are subject to third party special servicers, which vary widely in competency and effectiveness as fiduciaries. This is due to conflicts of interest created by both the typical fee structures and the special servicers’ right to buy the assets they service at ‘fair market value.’ Also, CMBS pools must pay additional third‐party costs such as master servicing and trustee fees that total approximately 10 to 25 basis points more than comparable whole loan expenses. Put together, these structural benefits have produced much higher default recoveries for private whole loans than CMBS loans over time, and ultimately led to long-term loss rates that compare positively with investment grade corporate bonds (Exhibits 3 and 4).
Exhibit 3: Long-term Average Default Recoveries
| Type | % |
| Commercial Mortgage Whole Loans | 80% |
| CBMS Conduit Loans | 47% |
Source: Commercial Mortgage Loans – American Council of Life Insurers 1998-2012, CMBS Conduit Loans – Bank of America Merrill Lynch 2004-2012
Exhibit 4: Long-term Average Annual Loss Rate
| Type | % |
| Commercial Mortgage Whole Loans | 0.01% |
| Investment Grade Corporate Bonds | 0.06% |
Source: Commercial Mortgage Loans – ACLI 1998-2012, Investment Grade Corporate Bonds – Moody’s Global Corporate Default 1982-2012.
Property Underwriting Factors
Commercial whole loans secured by income‐producing properties, while highly defensive when conservatively underwritten at origination, are not 100% invulnerable to the commercial real estate cycle. The soaring incidence and severity of default rates in the late 1980’s to early 1990’s (insurance lenders) and, more recently, in the late 2000’s (CMBS lenders) were largely driven by lending based on unwarranted property valuations resulting in overleveraged assets once values eventually normalized. In both cases, valuations were artificially inflated by poor underwriting, unrealistic income growth projections, and excessive cash chasing ‘trophy’ assets. For this reason, realistic valuations should be a major focus of whole loan investors.
Unlike the aforementioned periods of overvaluation, income‐producing property values currently provide an appropriate basis for near‐term lending opportunities, because 1) elevated vacancies and low rents provide cash flow upside for well‐positioned properties as economic and property fundamentals improve, 2) the 2008 to 2009 credit crisis resulted in valuation normalization.
Non‐bank institutional lenders are in a position to very carefully underwrite loans and pick only the most attractive opportunities. Similarly, many of the most sophisticated borrowers have exhibited a clear preference for institutional, rather than CMBS lenders due to the greater flexibility institutional investors can offer in terms of rate, loan structure, prepayment options, and earn‐outs. Therefore, insurance company lenders have a distinct advantage in winning higher quality loan opportunities.
Considerations for Whole Loan Investing
Property fundamentals such as market, tenancy, and particular individual property characteristics support an asset’s valuation and differentiate the best whole loan investments. Institutional quality U.S. assets are most often found in in‐fill locations within top 25 markets (e.g., New York City, Washington D.C., Houston, and San Francisco) or in secondary markets (e.g., Austin, TX, and Portland, OR) with particularly attractive demographics and employment statistics. Among the most important considerations are population size, age, income, and educational attainment as well as dominant industries and drivers of job growth. Furthermore, an asset should present favorable supply constraints such as zoning issues for new construction, easements, or limited buildable land. Lastly, vacancy and rent growth trends should reflect market strengths via stable or improving metrics.
A property’s tenancy is the second major consideration in underwriting a whole loan opportunity. Investment grade tenants are always preferable, but a diverse and staggered rent roll is equally important. In the case of a single tenant or owner‐occupier, the lease term should ideally extend well beyond the loan maturity. Furthermore, either multi‐tenant or single‐tenant properties should exhibit advantages over the competitive set to support re‐leasing in the event of unplanned vacancy.
Such individual property characteristics include: location within a market, construction quality, vacancy and rent relative to market, borrower and property manager experience, and the property’s overall capital structure.
- A building in an attractive submarket within an average secondary market might underwrite more favorably than a building located in a somewhat overbuilt or otherwise soft submarket within an attractive primary market. Strengths such as access to transportation nodes, submarket demographics, and area economic development initiatives can affect such a scenario.
- Construction quality includes building materials, layout, and accessibility. The best buildings exhibit flexibility in terms of configuration and access.
- Rents may be near or below market rates, and vacancy should be around the market level (or slightly below with demonstrable upside).
- Highly experienced borrowers and property managers will be more apt to fill vacant space in a timely and cost effective manner than less‐seasoned operators.
- Furthermore, well capitalized borrowers are often more likely to come out of pocket to cover unexpected leasing and tenant improvement expenses or interest shortfalls if reserve balances prove insufficient.
- Since whole loans are senior in the property capital structure to the borrower’s equity, the lender’s primary concern is the borrower’s ability to service the first mortgage under a default scenario. However, given the conservative underwriting associated with whole loan origination, the probability of a senior note holder losing principal is remote.
From an overall portfolio perspective, insurance investors seeking to diversify their current holdings may also find that commercial mortgage loans have historically exhibited low correlation with other public market alternatives (Exhibit 5).
Exhibit 5: Diversification Benefits
Source: Bloomberg, Barclays, IPD/MSCI Giliberto-Levy Index, AAM. Note: Correlation of quarterly total returns 6/30/2003 – 6/30/2013.
How to Invest in U.S. Commercial Mortgage Whole Loans
Investing in commercial mortgage whole loans can be accomplished via two mechanisms:
- Separate Single Client Account – Recommended for allocations $100 million and above
- This vehicle is most appropriate for significant allocations to ensure appropriate portfolio diversification.
- A single‐client account provides an investor with the most control over structuring the mandate, and controlling assets in foreclosure scenarios.
- Statutory Investment Trust – Recommended for allocations $100 million and below
- Statutory Investment Trusts are especially appropriate for smaller allocations to ensure proper diversification. This vehicle allows multiple investors to co‐invest in a pooled vehicle with a fully pre‐negotiated structure, while maintaining the favorable risk based capital treatment of the Separate Single-client Account
As shown in Exhibit 6, access to commercial mortgage loans has typically favored larger insurance companies with sufficient resources to build a diversified portfolio of loans. For instance, only 23% of life insurers with less than $300 million in assets owned direct commercial mortgages at the end of 2012 in comparison with 55% of companies between $300 million to $1 billion, and over 70% of those with assets over $1 billion. Accordingly, a Statutory Investment Trust vehicle is worth consideration for small and mid-sized insurers looking for diversified exposure to the asset class.
Exhibit 6: Insurance Company Commercial Mortgage Loans (CML) Holdings
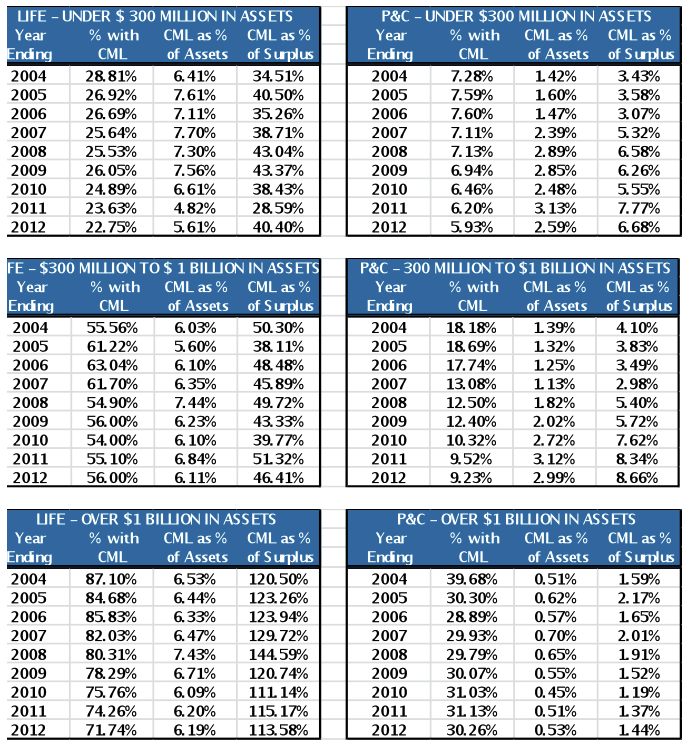
Source: SNL
Note: Companies in which mortgage loans constituted >50% of total assets were eliminated as outliers.
As is indicated in Exhibit 6, life insurers have been a much larger investor in commercial whole loan mortgages given the typical fixed rate, longer duration nature of the loans. Recent trends in the ability to structure shorter-term as well as floating rate loans might be appealing to property & casualty or health insurers with shorter duration liabilities.
Typical terms of new original whole loans are currently:
- Term: Between 3 and 15 years
- Amortization: 20 to 30 year schedule; selectively Interest Only
- Loan‐to‐Value: Maximum 75%
- Debt Service Coverage: Minimum 20x on Net Cash Flow
- Fixed Rate Spread to US Treasuries: 200+ basis points
- Fixed Rate Coupon: 5% to 5.0%
- Floating Rate Spreads: 200+ basis points
New Risk Based Capital Rules for Life Insurance Companies in 2013
The methodology used to determine risk based capital (RBC) for life insurance companies changed in 2013 to address the shortcomings of the previous approach. The mortgage experience adjustment factor has been eliminated in favor of establishing five risk cohorts with an assigned RBC charge for commercial mortgages in good standing. Each loan will be assigned to a risk cohort based on its debt service coverage (DSC) and loan-to-value (LTV). Exhibit 7 compares the RBC charges with those of corporate bonds and Exhibit 8 provides the DSC and LTV ranges which result in the RBC charges for commercial mortgages. The RBC factor for commercial mortgages held by property & casualty companies is simply 5%. It should also be noted that both Separate Account and Statutory Investment Trust investments in commercial mortgages are Schedule B assets subject to the same risk based capital rules. In addition, conservative commercial mortgage whole loans will typically fall into either RBC Group 1 or 2.
Exhibit 7: RBC Charge for Life Insurance Companies
| RBC Group | Commercial Mortgages | Corporate Bond |
| 1 | 0.90% | 0.40% |
| 2 | 1.75% | 1.30% |
| 3 | 3.00% | 4.60% |
| 4 | 5.00% | 10.0% |
| 5 | 7.50% | 23.0% |
Source: NAIC, AAM
Exhibit 8: Commercial Mortgage RBC Charge Description
| RBC Group | RBC Charge | Description |
| 1 | 0.90% | DSC=>1.50X and LTV<85% |
| 2 | 1.75% | 0.95 <= DSC < 1.50X / LTV<75% |
| 3 | 3.00% | DSC<0.95X and LTV<85% |
| 4 | 5.00% | DSC<1.15X and LTV=>100% |
| 5 | 7.50% | DSC<0.95X and LTV=>105% |
Source: NAIC, AAM
An Attractive Investment Alternative Today
Commercial mortgages have been an essential component of U.S. insurance company portfolios for over 100 years. Barriers to entry, as well as loan structures have traditionally relegated ownership to large life insurance companies. New investment vehicles, loan terms, and risk based capital rules, however provide access to more subsets of the insurance industry. In the context of the current macroeconomic environment, core commercial whole loans originated with conservative underwriting parameters, offer compelling yields and competitive risk characteristics that are attractive for insurance companies today.
About Quadrant
Quadrant is a SEC Registered Investment Advisor and leader in Commercial Mortgages with $6.4 billion of commercial and multifamily real estate assets under management for institutional clients. Since 1998, Quadrant has originated over $9.6 billion of private debt investments.
Written by:
Scott Skowronski, CFA
Senior Portfolio Manager
AAM
Richard Sauerman
Head of Global Research
Quadrant Real Estate Advisors
For more information, contact:
Colin Dowdall, CFA, Director of Marketing and Business Development
John Olvany, Vice President of Business Development
Neelm Hameer, Vice President of Business Development
30 North LaSalle Street
Suite 3500
Chicago, IL 60602
312.263.2900
Disclaimer: Asset Allocation & Management Company, LLC (AAM) is an investment adviser registered with the Securities and Exchange Commission, specializing in fixed-income asset management services for insurance companies. This information was developed using publicly available information, internally developed data and outside sources believed to be reliable. While all reasonable care has been taken to ensure that the facts stated and the opinions given are accurate, complete and reasonable, liability is expressly disclaimed by AAM and any affiliates (collectively known as “AAM”), and their representative officers and employees. This report has been prepared for informational purposes only and does not purport to represent a complete analysis of any security, company or industry discussed. Any opinions and/or recommendations expressed are subject to change without notice and should be considered only as part of a diversified portfolio. A complete list of investment recommendations made during the past year is available upon request. Past performance is not an indication of future returns.
This information is distributed to recipients including AAM, any of which may have acted on the basis of the information, or may have an ownership interest in securities to which the information relates. It may also be distributed to clients of AAM, as well as to other recipients with whom no such client relationship exists. Providing this information does not, in and of itself, constitute a recommendation by AAM, nor does it imply that the purchase or sale of any security is suitable for the recipient. Investing in the bond market is subject to certain risks including market, interest-rate, issuer, credit, inflation, liquidity, valuation, volatility, prepayment and extension. No part of this material may be reproduced in any form, or referred to in any other publication, without express written permission.