In recent years, there have been a number of crude oil discoveries and developments in places like North Dakota and Southern Texas where there is very limited existing infrastructure in place to move the oil to demand centers. As a result, oil companies have had to inefficiently transport crude oil hundreds of miles by rail or by truck to refineries. Transporting crude oil by rail or rig is far more costly – at least $10 per barrel more – than to move the hydrocarbon by pipeline. In other areas like northern Alberta, potential production easily eclipses the capacity of existing pipelines to move the production to market, which has contributed to substantial price discounts for Canadian crude oil. To reduce these costs and inefficiencies, a number of midstream companies are undergoing a massive new-build program, which will cost billions of dollars. These projects, which we expect will come online in the next five years, will require external financing, generate substantial cash flow and change the risk profiles of the involved companies.
Importantly, this paper concentrates on crude oil pipelines in North America. Different products (crude oil, gasoline, diesel, natural gas liquids, natural gas, etc.) get shipped on different pipelines after they leave the refinery. There are many, many new pipelines being built to transport natural gas and natural gas liquids from different shale plays to processing plants/refining facilities/end users. Those pipelines carrying natural gas and liquids other than crude oil will be the topic of a future white paper.
The following describes the supply characteristics of the North American crude oil market, identifies the larger transportation projects announced (including Keystone XL), estimates how these massive pipes could change the risk profiles of the involved companies and presents potential investment opportunities for fixed income investors.
Where are the Incremental Barrels Coming From?
Domestic oil supply has rebounded following a nearly two decade decline. In 2012, crude oil production has averaged about 6.2 million barrels per day, 23% greater than the trough in 2007/2008. This increase in domestic supply, detailed in Exhibit 1, is largely due to increased use of horizontal drilling and hydraulic fracturing of shale. The methodology being employed in the oil patch is identical to that used to radically change the natural gas supply landscape in the past five years.
Exhibit 1
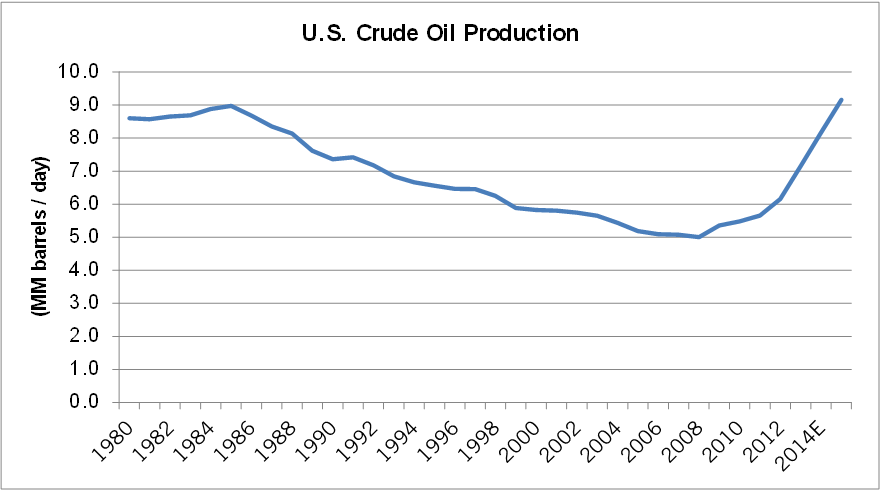
Source: Energy Information Agency; Bentek Energy
Unlike the natural gas shales, which are located in the Marcellus shale of Pennsylvania, the Barnett Shale of Northern Texas and the Fayetteville Shale of Arkansas, new oil basins are located in North Dakota (Bakken shale), Southern Texas (Eagle Ford shale) and the Permian Basin in West Texas/East New Mexico. Exhibit 2 describes that nearly all of the expected 95% increase in production from 2007 through 2016 will come from Texas (Eagle Ford, Permian), New Mexico (Permian) and North Dakota (Bakken).
Exhibit 2
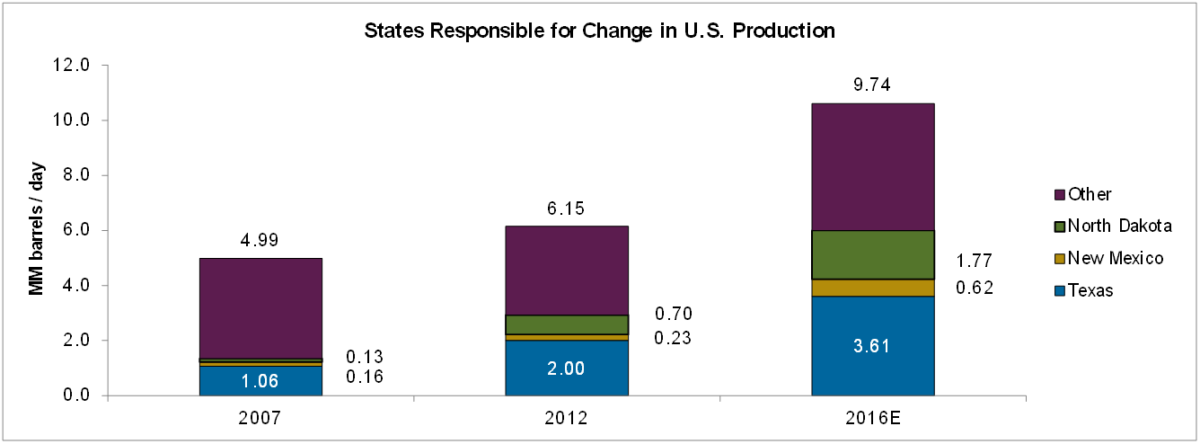
Source: Energy Information Agency; Magellan Midstream Partners; Bentek
The lion’s share of Canadian production continues to originate in northern Alberta. In the next three years, a number of long-life oil projects from Ft. McMurray, Alberta will be the source for an incremental 500,000 barrels of oil per day of production. Companies such as Statoil, ConocoPhillips, Suncor, Husky, Nexen, Cenovus and Canadian Natural are all eager to achieve returns on their long term and capital intensive projects. These returns are largely dependent on a pipeline(s) transporting this heavy Canadian crude to Gulf Coast refineries capable of processing this quality of crude.
Exhibit 3
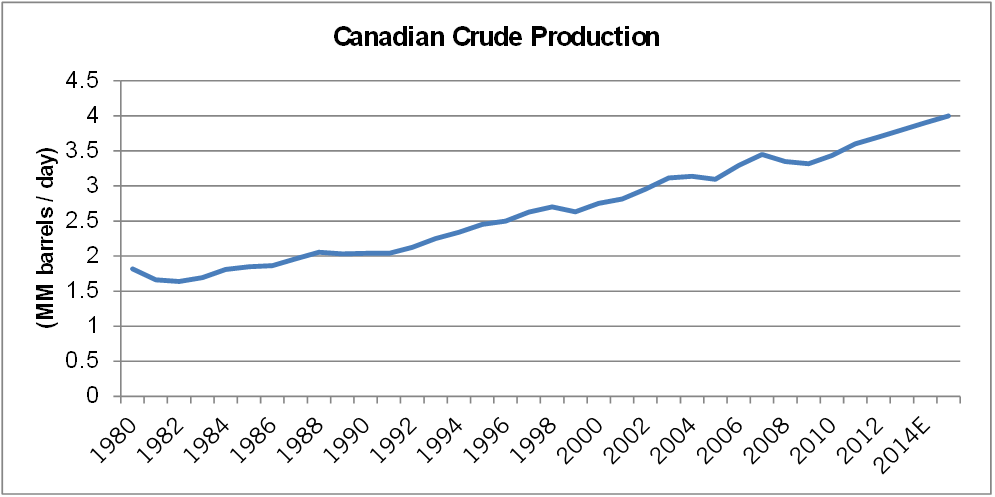
Source: Energy Information Agency; Bentek; Enbridge
The Infrastructure Supporting Greater Crude Production
There currently exists a “supply-push” environment, particularly in takeaway-capacity short regions like Ft. McMurray, the Bakken shale and the Eagle Ford shale. This scenario has lead to a substantial amount of new pipeline new-builds/announcements in the past several quarters. We have identified 17 distinct crude oil pipeline projects (Exhibit 4), which are expected to transport large amounts of crude oil from these regions to Chicago, Houston and Cushing, Oklahoma. In total, the projects listed in Exhibit 4 will have the capacity to transport more than 7 million barrels per day (For relativity, the U.S. currently produces about 7 million barrels per day). Additionally, the cost to complete all of these projects will be approximately $20 billion over the next three to five years.
Generally speaking, Exhibit 4 reveals that the Bakken shale and Canada require the most capital to build take away capacity. This is intuitive as the Permian Basin already has existing pipeline capacity and the Eagle Ford shale is much closer to a demand center (Houston) than either northwest Canada or the Bakken shale.
Interestingly, two companies with Canadian roots, Enbridge Energy Partners and Transcanada have the most to gain from the completion of the announced crude oil pipelines. Enbridge Energy Partners’ Flanagan South pipeline will transport 600,000 barrels of Bakken crude oil per day to refiners in the Gulf Coast. This $2.8 billion project would represent an incremental 20% of value to Enbridge Energy Partners. TransCanada will benefit when the controversial Keystone XL gets approved and is operational. As indicated below, this behemoth of a project will ultimately transport 510,000 barrels of Canadian crude 1,900 miles from northwestern Alberta to Steele City, Nebraska. At this juncture, it will meet up with the already operational Keystone pipeline south to Cushing, Oklahoma. This $5.3 billion project would expand TransCanada’s value by 10%.
Exhibit 4
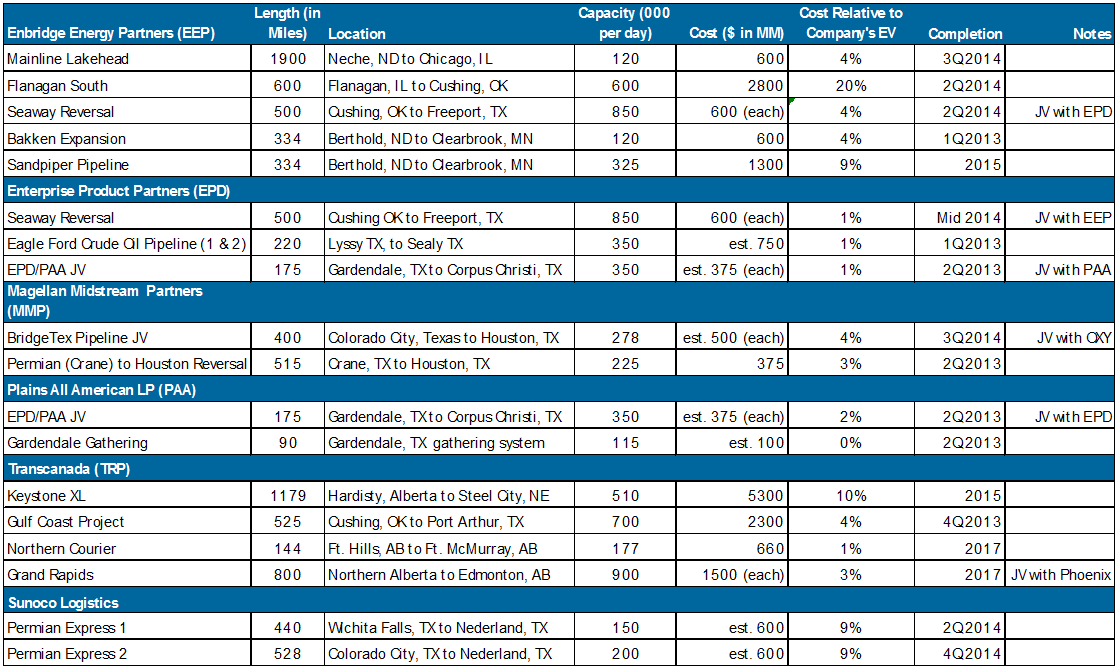
Source: AAM and company reports
Is There an Opportunity for Fixed Income Investors to Exploit?
Midstream companies like those listed in Exhibit 4 are frequent debt issuers so there will be opportunities to gain exposure to the companies and projects that offer compelling risk-adjusted return investments. However, the majority of the pipelines listed above will be funded at the company level rather than by project financing. As a result, an evaluation of the overall company risk profile will be necessary rather than simply determining the credit quality of the individual crude pipeline.
Evaluating midstream companies is unique relative to other industrial issuers for several reasons. First, the majority of the midstream peer group is made up of master limited partnerships (MLPs), a tax-advantaged corporate structure. Under these partnership agreements, MLPs distribute 100% of available cash to unit holders after operating expenses, maintenance capital expenditures and debt service. Because of this corporate structure where the entity does not retain cash/equity, new projects are nearly always funded with external capital. As a result, leverage and financial flexibility is a crucial factor in assessing MLP risk.
Additional items we consider when evaluating an MLP is the size of the company, the diversity of its operations, the contracts which determine its cash flows and management. Scale is an important factor when analyzing an industrial issuer because it reflects the company’s financial resources and access to capital markets. Diversity (both by product and by geography) is an essential variable to analyze when evaluating an MLP because of changes in the supply and or demand of different hydrocarbons, changes in the competitive landscape of different regions and changes in the regulations of different types of pipelines. We have listed in Exhibit 5 the risk spectrum of different pipeline types. Of all the hydrocarbons shipped via pipelines, we believe the business of transporting crude oil to be among the lowest risk, particularly for the emerging oil plays in North America. As a result, we believe that most of the projects identified in Exhibit 4 would improve the credit quality of the issuers, provided the project is funded in a balanced manner.
Exhibit 5

Source: Moody’s
We will closely monitor the contracts of these new pipelines for “fee-based revenues” between the midstream company and the production companies. Notably, the critical importance of these new pipelines for helping production companies getting their product to market, should allow the midstream companies to demand fee-based contracts with nearly 100% volume commitments, a credit positive. This type of contract would help mitigate concern about stranded assets due to depleting reserves.
It is abundantly clear that the North American crude oil landscape is changing. This is best reflected by comparing the top domestic oil producing regions from 2007 to 2012. Currently, Texas is at the top of the list, followed by the Gulf of Mexico and North Dakota. Diving down further reveals that since 2007, Texas and North Dakota’s production has increased by 88% and 461%, respectively. Conversely, crude oil production from the Gulf of Mexico, California and Alaska has declined by 17%, 10% and 37%, respectively. Both the positive trend for Texas and North Dakota and the negative trend for Alaska and California are expected to continue in the next three years. The changing supply dynamics of the U.S. and ever increasing supply out of Canada are going to require large capital investments in infrastructure to efficiently transport the crude oil to refiners. We will monitor the progress of the pipeline projects identified, some of which will alter the companies involved like Energy Partners and Transcanada. Moreover, we may be active in the funding of these projects to the extent that the issuers provide us with worthy risk adjusted return potential.
Exhibit 5: Expanding Pipeline Options
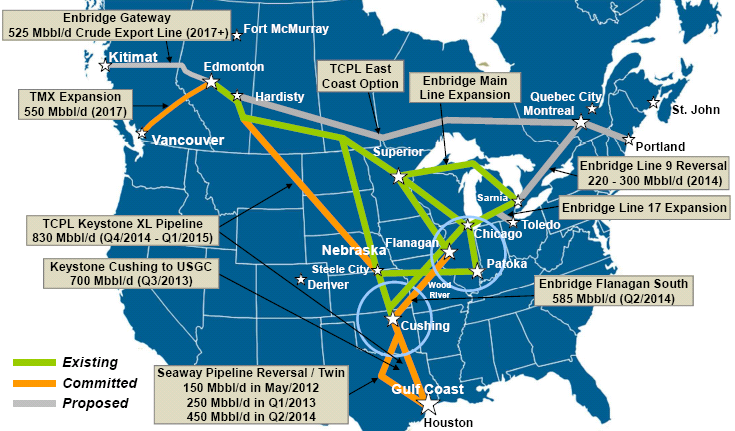
Source: Canadian Natural Resources Limited
Written by: Patrick McGeever, Senior Analyst, Corporate Credit
Disclaimer: Asset Allocation & Management Company, LLC (AAM) is an investment adviser registered with the Securities and Exchange Commission, specializing in fixed-income asset management services for insurance companies. Registration does not imply a certain level of skill or training. This information was developed using publicly available information, internally developed data and outside sources believed to be reliable. While all reasonable care has been taken to ensure that the facts stated and the opinions given are accurate, complete and reasonable, liability is expressly disclaimed by AAM and any affiliates (collectively known as “AAM”), and their representative officers and employees. This report has been prepared for informational purposes only and does not purport to represent a complete analysis of any security, company or industry discussed. Any opinions and/or recommendations expressed are subject to change without notice and should be considered only as part of a diversified portfolio. A complete list of investment recommendations made during the past year is available upon request. Past performance is not an indication of future returns. This information is distributed to recipients including AAM, any of which may have acted on the basis of the information, or may have an ownership interest in securities to which the information relates. It may also be distributed to clients of AAM, as well as to other recipients with whom no such client relationship exists. Providing this information does not, in and of itself, constitute a recommendation by AAM, nor does it imply that the purchase or sale of any security is suitable for the recipient. Investing in the bond market is subject to certain risks including market, interest-rate, issuer, credit, inflation, liquidity, valuation, volatility, prepayment and extension. No part of this material may be reproduced in any form, or referred to in any other publication, without express written permission.


Utilities: Affordability Takes a Prominent Role in an Active Political Year
February 9, 2026