This topic was originally published May 2017. This paper is an update of the ideas discussed in the prior version.
Ratio analysis is a cornerstone of financial analysis – and for good reason. In this age of algorithmic trading, Big Data-driven advertising, and machine learning programs teaching cars to drive themselves, it’s reassuring to consider just how much we can learn about a company by dividing one financial statement item by another and comparing the result to a peer group.
Many useful ratios exist for analyzing and comparing P&C insurer financials. In this update to our 2017 paper entitled “Deconstructing Risk”, we once again start with the proverbial “Bottom Line”: Return on Surplus. We will review how to decompose this measure into 4 subsidiary ratios to better identify the drivers of profitability. They are:
Underwriting profitability
Underwriting leverage
Investment profitability
Investment leverage
Two companies with similar profitability might look very different when broken down in this way. Below we will discuss the significance of each of these measures, and sum up by showing how at least some of them show notable correlation to an insurer’s AM Best Financial Strength Rating.
Return on Surplus
Return on Surplus is calculated by dividing net income by average annual surplus. It’s the most common measure of insurer profitability, and makes for useful comparisons both across time and across companies. However, as a summary measure it tells us very little about how profits are being generated or the level of risk involved in a company’s strategy. We can learn much more by separating this measure into underwriting and investment components, and then further dividing each of those into profitability and leverage measures.
Underwriting
P&C insurer underwriting profitability is traditionally measured by the combined ratio, which is essentially [Underwriting Losses & Expenses] divided by [Net Premium Earned]. A value over 100 indicates a loss, below 100 indicates a profit, etc. For our purposes we translate this measure into a more universal profit margin measure by subtracting the combined ratio from 100, which amounts to [Underwriting Gain/Loss] divided by [Net Premium Earned]. We’ll coin a term and call this “Underwriting Margin”. Fundamentally, this measure encompasses pricing sufficiency, loss cost containment, and in some cases cat experience for a given year.
Next we need an underwriting leverage measure. Normally this would be measured as [Net Premium Written] divided by [Average Surplus], but for the sake of consistency across ratios we will instead use [Net Premium Earned] as the numerator, which in practice is usually very similar. As a leverage measure, this ratio acts as a kind of multiplier, magnifying or dampening the impact of underwriting profitability on surplus.
(that may sound technical, but think of it this way: if you write a large amount of premium relative to your available surplus, then the question of whether you generally make a profit or a loss on those premiums is going to have major positive or negative implications for your surplus. That’s the effect we’re measuring.)
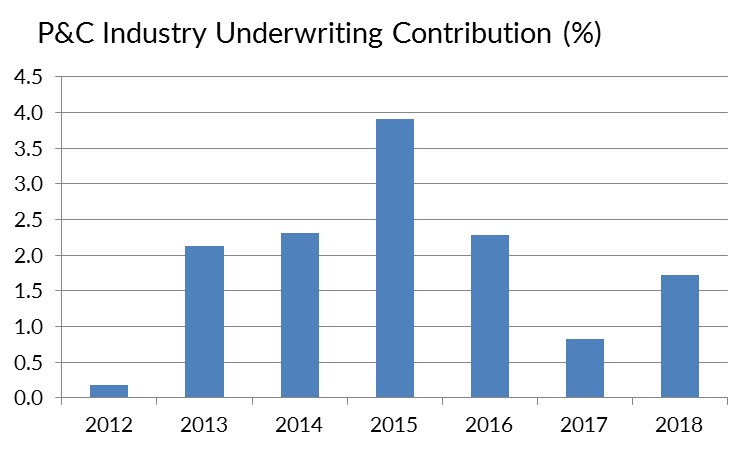
Attentive readers will notice the card trick we’ve set up here. By multiplying our underwriting and profitability ratios together, the [Net Premium Earned] terms cancel out and we’re left with [Underwriting Gain/Loss] divided by [Average Surplus]. This is the contribution to Return on Surplus from underwriting operations. Astonishing, I know, but we’re only getting started.
Before moving on to investments, here’s a quick look at trends in profitability and leverage for P&C insurers in recent years. The tables below show median values for these statistics for a composite of 735 P&C companies that collectively make up a majority of the industry:
Exhibit 1
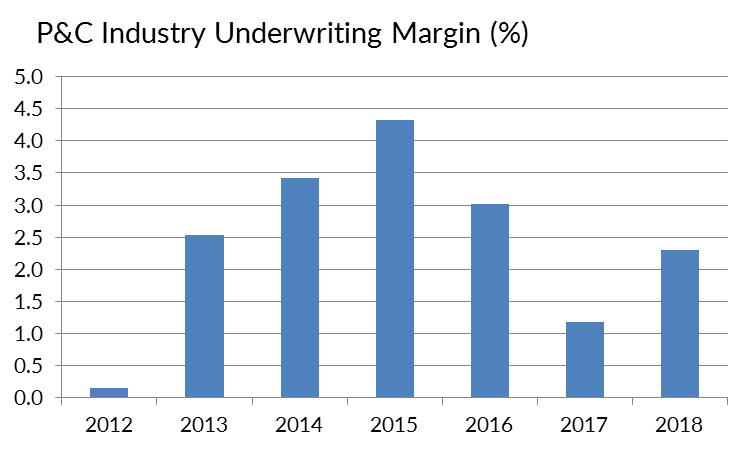
Exhibit 2
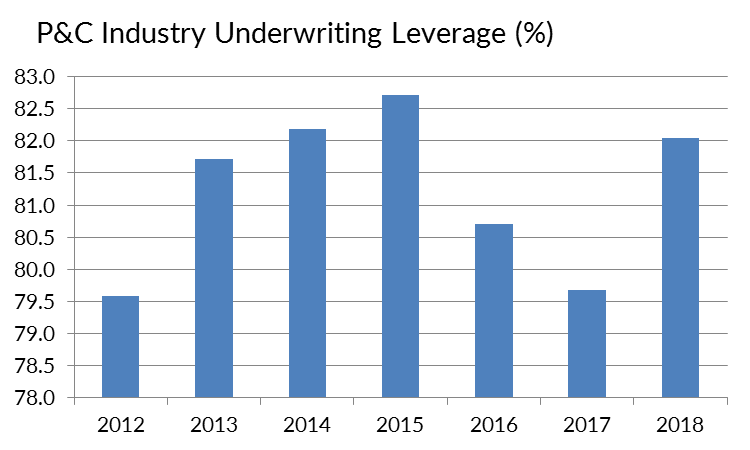
We see considerable variation in underwriting margin from year to year, as one would expect from an industry subject to not only normal competitive pressures and economic fluctuations, but also the volatility of annual storm and disaster experience. However, median underwriting leverage is considerably more stable (note the compression of the vertical axis), with the result that total underwriting contribution is mainly driven by swings in profit margin from year to year:
Exhibit 3
Investments
The main invested assets held by P&C insurers include investment-grade bonds, common stocks, cash, and other asset classes. These provide income, dividends, and capital gains that frequently make up a major portion of a P&C company’s annual returns. As with underwriting, we can look at the investment contribution in terms of both profitability and leverage.
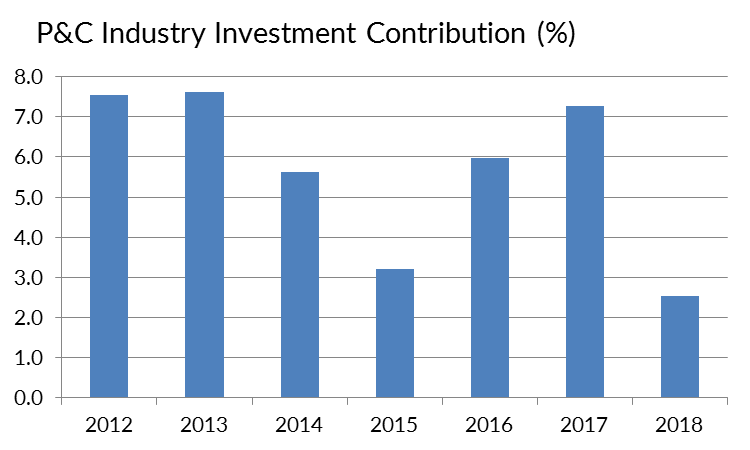
To measure profitability, we will once again use a somewhat novel term. While “investment yield” is a widespread concept that measures investment income over average assets for a period, we will instead conceive “investment margin” as the sum of all statutory investment returns over average assets. In other words this includes not just investment income, but also realized gains and the change in unrealized gains/losses on certain assets (like equity) that receive mark-to-market accounting treatment. This gives a more comprehensive view of the contribution of investments to the bottom line. This measure is likely to be fairly volatile from year to year given the effects of equity and other total return assets, but over time it gives the fullest picture of an insurer’s (or their asset manager’s) success at producing returns from invested assets.
Meanwhile our investment leverage measure takes average invested assets over average surplus (technically since these are both balance sheet measures we could just use point figures instead of averages, but we want our terms to agree across ratios). As with underwriting leverage, having a very large portfolio relative to your surplus will naturally magnify the impact of your portfolio return on surplus.
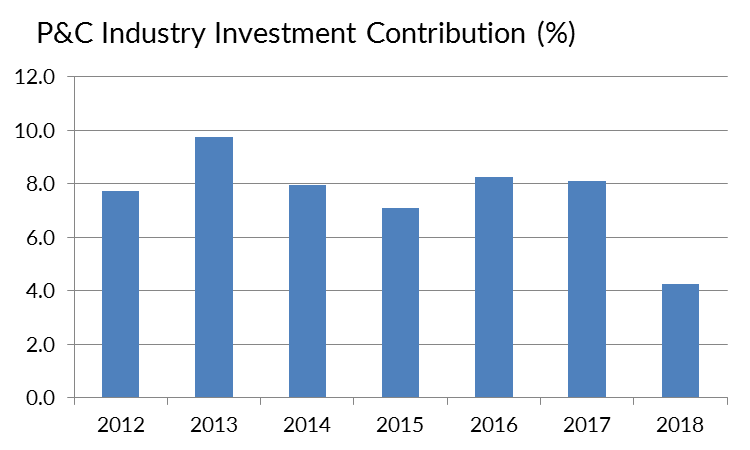
By now you see where this is going: if we multiply our profitability and leverage measures together, the [Average Invested Assets] terms cancel out and we get [Total Investment Return] divided by [Average Surplus], which is the investment contribution to Return on Surplus. It’s all fitting together like a fine Swiss watch.
How do these investment measures look for the P&C industry over time? Let’s take a look:
Exhibit 4
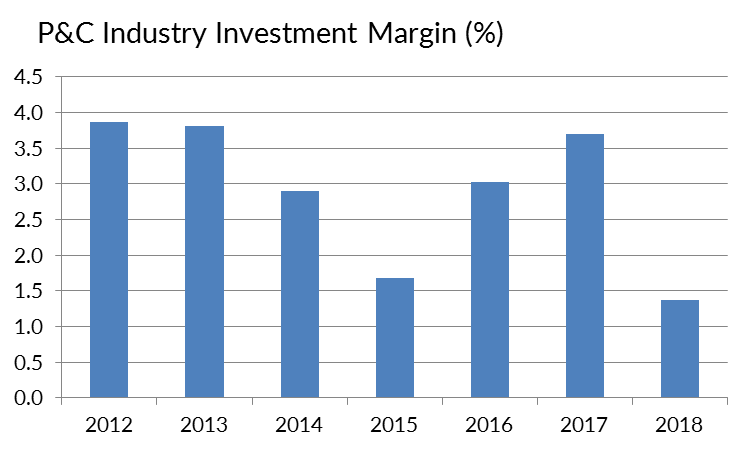
Exhibit 5
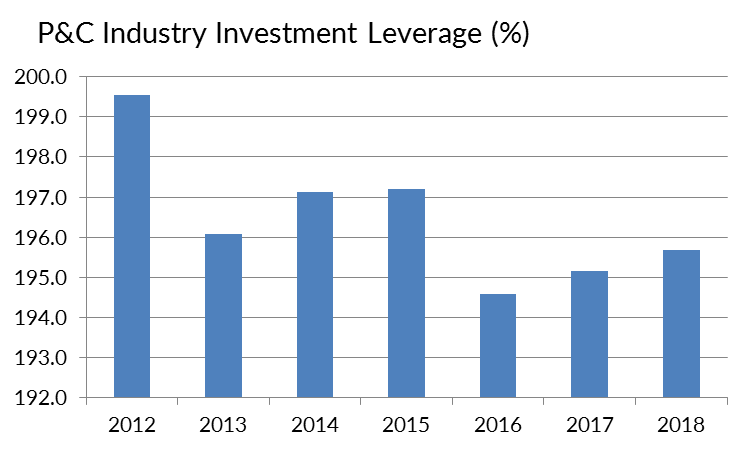
Once again we see that the variation is mostly on the profitability side, with annual equity market returns a major wild card (cf. 2017 vs. 2018 returns). Meanwhile balance sheet leverage has remained fairly steady. Here is the resulting contribution to surplus from investments:
Exhibit 6
Return on Surplus (Again)
So putting it all together, we just add the two contributions together to get total Return on Surplus:
Exhibit 7
That’s impressively stable over time, and a good illustration of how uncorrelated investment and underwriting returns help diversify the P&C insurance industry’s results and smooth out performance.
(An important caveat: the above figures likely differ from other reports you may have seen touching on P&C industry profitability. The framework above excludes certain discretionary and non-operating items such as Policyholder Dividends, Other Income/Expense, and taxes. It also includes the mark-to-market surplus impact of equity, which is a legitimate statutory item but is not a component of Net Income.)
Application to AM Best Rating
AM Best Financial Strength Ratings are based on a company’s BCAR score and analyst evaluations of Operating Performance, Business Profile, and other factors. We can find confirmation in both the validity of our ratio analysis framework above, and the rigor of AM Best’s review process, by illustrating the correlation of most of these measures to ratings categories:
Exhibit 8
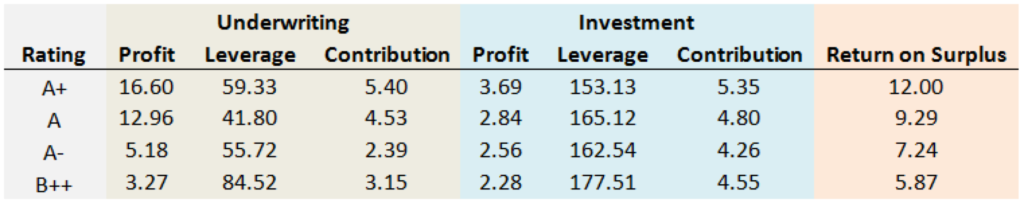
(the above figures were calculated by taking a collection of 228 rated P&C insurers, determining the 3yr trailing average for each statistic as of 12/31/18, and then taking the median of those values for each ratings category.)
There’s a clear trend of higher ratings correlating with higher underwriting profitability, higher investment profitability, and lower investment leverage (i.e. higher capitalization). With the exception of the (very small) A+ category, higher ratings also align with lower underwriting leverage. This should come as no surprise; again, two of the key building blocks of a rating are Operating Performance and Balance Sheet Strength, so it’s natural that high profitability and low leverage lead to higher ratings.
Looking at things this way can help an insurer compare whether their own metrics “look like” their current or desired ratings peers, and potentially identify if they are at risk for downgrade (or upgrade).
Final Takeaways
By splitting Return on Surplus into the two separate sources of return and leverage, we gain a clearer picture of the structure of an insurer’s earnings. The profitability measures (Underwriting Margin and Investment Margin) illustrate the effectiveness of the company’s underwriting and investment strategies at producing competitive returns, and the leverage measures (Underwriting Leverage and Investment Leverage) indicate how aggressive they are in terms of taking on underwriting & investment risk relative to available surplus.
Observing the trends in these measures over time can give us insight into an insurer’s strategic direction, and help managers evaluate how well they’re executing on their intended strategic priorities.
At AAM, we make it a priority to understand our clients’ unique needs and strategic goals. To gain a deeper perspective on how these ratios can help support your strategic planning, visit www.aamcompany.com/contact-us for a custom analysis.
Disclaimer: Asset Allocation & Management Company, LLC (AAM) is an investment adviser registered with the Securities and Exchange Commission, specializing in fixed-income asset management services for insurance companies. Registration does not imply a certain level of skill or training. This information was developed using publicly available information, internally developed data and outside sources believed to be reliable. While all reasonable care has been taken to ensure that the facts stated and the opinions given are accurate, complete and reasonable, liability is expressly disclaimed by AAM and any affiliates (collectively known as “AAM”), and their representative officers and employees. This report has been prepared for informational purposes only and does not purport to represent a complete analysis of any security, company or industry discussed. Any opinions and/or recommendations expressed are subject to change without notice and should be considered only as part of a diversified portfolio. Any opinions and statements contained herein of financial market trends based on market conditions constitute our judgment. This material may contain projections or other forward-looking statements regarding future events, targets or expectations, and is only current as of the date indicated. There is no assurance that such events or targets will be achieved, and may be significantly different than that discussed here. The information presented, including any statements concerning financial market trends, is based on current market conditions, which will fluctuate and may be superseded by subsequent market events or for other reasons. Although the assumptions underlying the forward-looking statements that may be contained herein are believed to be reasonable they can be affected by inaccurate assumptions or by known or unknown risks and uncertainties. AAM assumes no duty to provide updates to any analysis contained herein. A complete list of investment recommendations made during the past year is available upon request. Past performance is not an indication of future returns. This information is distributed to recipients including AAM, any of which may have acted on the basis of the information, or may have an ownership interest in securities to which the information relates. It may also be distributed to clients of AAM, as well as to other recipients with whom no such client relationship exists. Providing this information does not, in and of itself, constitute a recommendation by AAM, nor does it imply that the purchase or sale of any security is suitable for the recipient. Investing in the bond market is subject to certain risks including market, interest-rate, issuer, credit, inflation, liquidity, valuation, volatility, prepayment and extension. No part of this material may be reproduced in any form, or referred to in any other publication, without express written permission.