insight
Finally…The Year for Higher Rates?
February 11, 2015
MACRO-ECONOMIC REVIEW AND OUTLOOK
U.S. economic growth for 2015 is expected to improve modestly from last year as consensus forecasts project real GDP will increase 3.0% compared to the 2.5% increase for 2014 (Exhibit 1). The improvement in economic activity is predicated on better prospects for consumer spending stemming from continued job growth, lower energy prices, and rising consumer confidence. U.S. payrolls increased by nearly 3 million last year and the pace of job growth is expected to improve this year. The unemployment rate is projected to decline to 5.2% by year end. The greater than 50% fall in oil prices since last June will benefit consumers through an increase in their real disposable income.
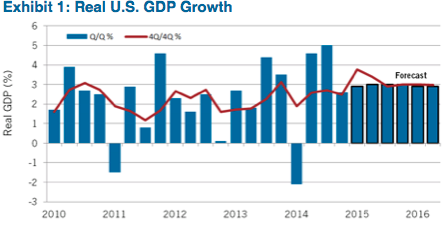
Offsetting the positive factors are weaker growth abroad, a stronger U.S. dollar, and less favorable financial conditions. With U.S. monetary policy on a divergent path from other major economies, the U.S. dollar is expected to remain strong, resulting in weaker U.S. exports. AAM views the risks to economic growth in 2015 to be skewed to the downside.
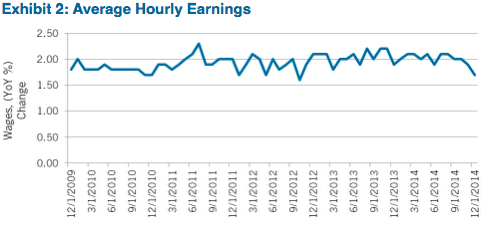
With respect to U.S. monetary policy, the markets are currently pricing in a mid-2015 timeframe for the Federal Open Market Committee (FOMC) to begin raising rates. The exact timing of when the FOMC will raise rates will be dependent on how incoming data impacts the FOMC’s outlook for employment and inflation. On the employment side, the FOMC expects that above trend economic growth for 2015 will lead to continued improvement in the labor market, leading to a lower unemployment rate. On the inflation side, core inflation remains below the FOMC’s target of 2%. It is expected that the FOMC will begin raising rates despite core inflation below its target level provided that the committee is “reasonably confident” in its outlook for inflation to return to their target. A strong U.S. dollar, falling oil and other commodity prices, and global disinflationary pressures have put a lot of uncertainty on the outlook for inflation. In addition, the improvement in the labor market has yet to lead to higher wages as average hourly earnings increased only 1.7% in 2014 (Exhibit 2). The committee has stated that it is “reasonably confident” that inflation will return to the long-term target level.
Based on recent speeches from FOMC voting members, all 2015 voters appear to support a patient and gradual approach to the pace of tightening. AAM expects the first rate increase to occur late third quarter with risks skewed towards a later date versus a sooner one.
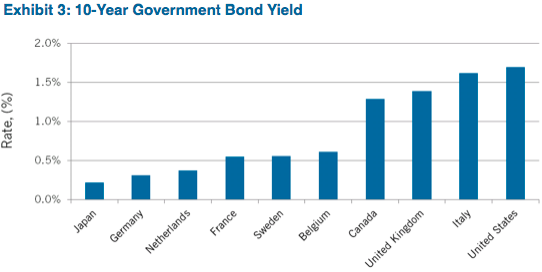
With economic activity projected to increase and the FOMC expected to begin raising short-term interest rates this year, consensus forecasts are calling for a modest increase in Treasury yields over the course of 2015. The yield on the benchmark 10-year Treasury note is expected to increase by about 60 basis points (bps) and end the year at 2.80% based on the median estimate of economists polled by Bloomberg (Exhibit 3). Long-term U.S. Treasury yields are being anchored by low inflation expectations in the U.S., deflationary pressures abroad, and low levels of foreign government yields.
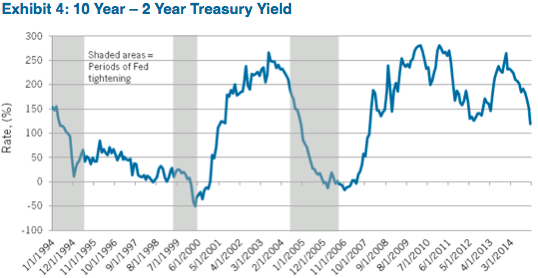
AAM is expecting the yield on the 10-year Treasury note to increase this year but end the year below consensus estimates (Exhibit 4). The lower-than-consensus forecast is due to our expectation of a later start to the Fed raising rates. Furthermore, low foreign government yields and a stronger U.S. dollar are attracting capital to the U.S. As in past periods of Fed tightening, the yield curve is expected to flatten. Last year, the 10s/2s Treasury curve flattened by 114 bps as the 10-year yield fell 86 bps while the 2-year yield increased 28 bps. In the last two periods of Fed tightening, the 10s/2s yield curve fell below zero by the time the Fed concluded raising the Fed Funds rate. With the 10-year yield projected to increase only modestly this year, AAM expects the yield curve (10s/2s) to continue the flattening trend that started last year.
CORE FIXED INCOME OUTLOOK SUMMARY
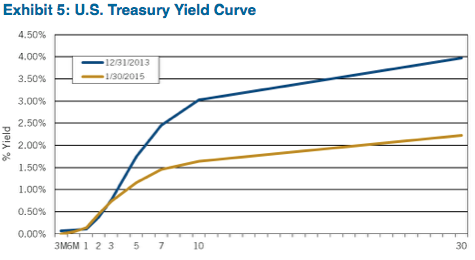
For the past 13 months ending January 31, 2015 the yield on the 30-year Treasury fell 175 bps to 2.22% (Exhibit 5). Going into last year, the market expected a continuation of higher rates and an increase in the Fed funds rate around the third quarter of 2014. Economists and market based estimates missed significantly; growth froze in the first quarter and although it warmed back up in the second, it was faltering by year end. Europe struggled with declining GDP and deflation. China missed growth estimates, contributing to a broader decline in spending which added velocity to the selloff in commodity prices.
Given this environment the Investment Grade (IG) fixed income market did very well for the year (Exhibit 6). As we expected, the top performer was Tax-Exempt Municipals, with the index returning 9.05% compared with the similar duration Treasury sector which returned 5.05%. Tax-Exempts started 2014 as the most attractive IG class, and by April 22 had become the least attractive class. We had a significant overweight to this sector and were able to capitalize on the strong performance by significantly reducing our holdings on April 22 and April 23.
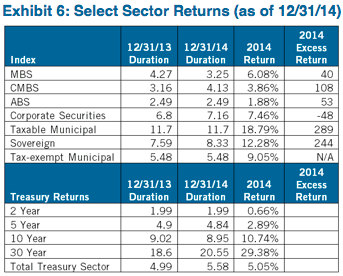
The clear winner for the best bond of 2014 was the 30 year Treasury, returning 29.38%. The best Taxable sector in both absolute and relative terms was Taxable Municipals (18.79% and 289 bps excess spread). Corporate bonds suffered as oil prices dropped significantly and the estimates for global growth fell.
2015 Outlook
In the first inning of a ballgame at Wrigley Field, if the Cubs are losing 3-0, everyone has a pretty good sense where things will end up (and it isn’t good!). However, in the markets as in most other games you can expect plenty of changes over the next eight innings. Today we have the benefit of seeing the first month of activity in the markets, but it’s a long game. As of Feb 6, we’ve seen two strong months of job growth, it appears as if oil has found a floor, and there is a better tone to the market overall. Interest rates are lower by around 25 bps five years and out, but have risen sharply in the past week.
With the yield curve significantly flatter, longer duration securities are expected to fall in price when the Fed signals that it intends to raise the Fed funds rate. Last year we expected the Fed funds rate to remain unchanged and the longer end of the yield curve to move up and down with changes to the economic outlook or exogenous events, finishing around where it started. However, we did not expect 2014 to end with a 2.17% ten year note and WTI crude at $53.27 per barrel.
We expect that Treasury returns will be negative outside of five years during 2015 as rates begin to move higher in anticipation of Fed action. If the curve continues to flatten between 10 and 30years, we will look to reduce exposure to the long end as returns are asymmetrical at these low yield levels.
For 2015, we expect the Corporate sector to be the strongest performer. Although late in the cycle, there are attractive sub-sectors that will offer opportunities for spread tightening during the year. We expect both ABS and CMBS sectors to outperform Treasuries due to strong demand and limited supply. Although Agency MBS has not performed well thus far in 2015, it is still not attractive given the high dollar prices of the securities and limited spread pickup versus Treasuries. Therefore, we are maintaining our underweight to the sector. However, we expect further weakness that should lead to a buying opportunity during the course of the year. Because of low rates and the opportunity for refinancing within the Tax-Exempt market, we think the excess supply will keep performance muted and expect some near term underperformance in this sector.
CORPORATE CREDIT
2014 Review
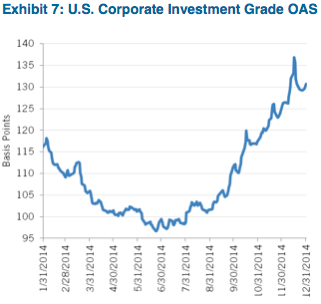
The investment grade corporate fixed income market closed the year losing 48 bps of return versus Treasuries, after falling oil prices sent spreads wider in the fourth quarter (Exhibit 7).
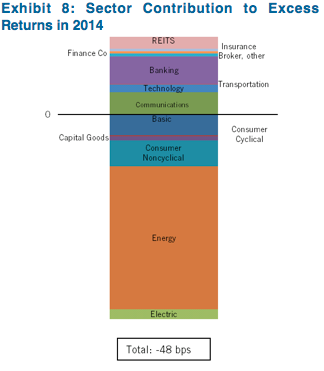
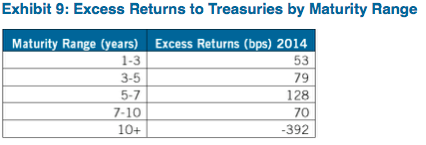
As shown in Exhibit 8, Banks, Real Estate Investment Trusts (REITs), and Communications outperformed, but positive performance was more than offset by spread widening in Energy. The other significant driver of performance was long dated maturities, which moved wider as Treasury yields fell. In fact, excess returns were positive for all maturity buckets except 10+ years according to Barclays (Exhibit 9).
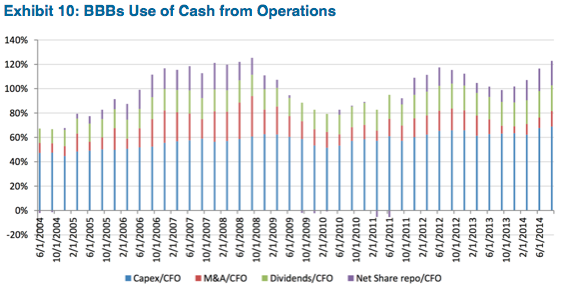
Companies became more aggressive financially in the second half of the year as it became clear that the first quarter economic weakness was weather related. Spending on capital projects and share repurchases by non-financials accelerated to levels last seen in 2007 (Exhibit 10). This was evident in BBB rated non-financial companies in particular, as cash balances were depleted to finance this activity. Therefore, leverage increased slightly in 2014; although interest coverage remained relatively flat.
Financials performed very well in 2014. Banks benefited from a pick up in commercial and industrial, commercial real estate, and auto loan growth as well as continued strengthening of balance sheets through growing capital levels. Credit standards eased and deposits increased. We are still waiting for regulatory clarity (total loss absorbing capital (TLAC) as a component of Orderly Liquidation Authority) around debt and capital levels required to minimize the probability of a bank bailout in the future. REIT financial performance was also strong, profiting from a strengthening economy, manageable property supply, and a beneficial rate environment.
The last driver of spreads was weaker technicals, with investment grade debt issuance exceeding expectations from September through December; a time of heightened market volatility. Over $1 trillion of gross debt was issued in 2014 compared to $703 billion issued in 2010, the peak of the current credit cycle. In addition, broker dealer inventories of investment grade corporate bonds maturing more than one year fell approximately 30% from early October to December, negatively contributing to liquidity.
2015 Outlook – Nearing the End of the Cycle
Economic growth in the U.S. is projected to be 3.0% in 2015, supported by stronger consumer spending. Small business optimism is also at a pre-crisis high. Lower oil prices are expected to be a net positive to the economy in 2015, with HSBC quantifying the drag to the domestic economy from lower oil prices at 0.4% of GDP offset by a 0.5% benefit. The stronger job market and consumer spending is expected to lead the Fed to raise rates in the second half of the year, causing the Treasury curve to flatten.
Outside the U.S., higher rates and lower oil prices will prove problematic for emerging economies such as Brazil, while countries such as China, Europe and Japan battle various forms of slowing growth or deflation. Emerging market spreads continued to underperform in 2014, and until we gain more confidence about the stability of their economies, we will remain on the sidelines. We expect emerging market issuers to be less active this year as energy related spending is curtailed and as they look to repay debt they issued in U.S. dollars to invest in higher yielding local deposits. Credit growth worldwide has been very stubborn, and is not likely to grow meaningfully given the high overall level of debt and increased likelihood of increased rates in the U.S.
Last year, we wrote that we believed we were moving from the “recovery” part of the credit cycle to the “expansionary” part, or the last stage before “downturn.” Signs of late stage behavior at a market level were present in the high yield and convertible markets and the investment grade market was not far behind given the strong momentum in the fourth quarter 2013. Given the actions taken by companies in 2014 and market related signals, we believe the credit cycle is now in the late stage of the expansion. Recall, credit cycles have historically turned one to two years before the economy.
The domestic economy is expected to perform well this year. Once oil prices stabilize, credit spreads should tighten, providing total return oriented investors with an opportunity to reduce exposure to BBB and other higher beta Corporate bonds in anticipation of widening once we enter the downturn, which we expect will happen in the next 12 to 18 months. We expect the Corporate market OAS to be within a range of 120 – 175 bps in 2015, reflecting a normalized level of volatility, as Central Bank support is withdrawn and late credit cycle dynamics take over. Our base case forecasts modestly positive excess returns for 2015, with risks skewed to the downside.
Will Oil Prices Stabilize?
We thought it wise to dedicate a portion of our Outlook to Energy. Below, we analyze the current oil fundamentals and the three factors we believe are critical to achieving stable crude prices. We conclude with our view that while it may be too early to add to Energy exposure, we do not believe it is prudent to broadly reduce positions.
The latest worldwide supply data available from the International Energy Agency (IEA) suggests worldwide production was 94.3 million barrels per day in the fourth quarter of 2014. The latest worldwide consumption estimates from the IEA suggests that consumption was approximately 93.4 million barrels per day in December. This all suggests that at year-end, supply exceeded demand by about 0.9 million barrels per day (less than 1% of demand), which is very close to forecasts made this time last year.
A review of the forecasts made by IEA one year ago, reveals that actual demand for 2014 met the 2013 IEA forecast (92.4 million barrels for all of 2014) and non-OPEC supply (the IEA does not forecast OPEC supply) came in exactly as the IEA had forecast (56.5 million barrels). This makes the speed and magnitude of the price decline surprising.
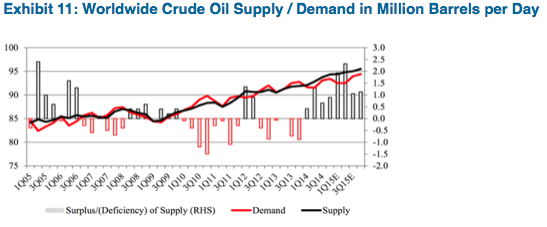
Exhibit 11 provides some historical context on supply and demand for crude oil as well as the surplus/deficiency over the last 10 years. There have been 19 quarters in the past 10 years when supply exceeded demand creating a surplus. During that time, the average quarterly surplus/deficiency was a surplus of about 0.1 million barrels per day. The expected surplus in the first quarter of 1.4 million barrels per day will equate to 1.6 standard deviations greater than the 10-year mean (Z-score). While a surplus of this size should undoubtedly put pressure on prices, we would have expected the Z-score to have been greater given the 57% decline in crude prices since June 2014.
In fact, an analysis of the 19 occasions specifically over the last 40 quarters when supply exceeded demand, indicates that the average surplus during those periods was 0.8 million barrels per day. The expected surplus in first quarter of 2015 of 1.4 million barrels per day would be approximately one standard deviation greater than the mean of the 19 periods when there was a surplus. In our opinion, this too suggests that prices should have declined, but not to the degree experienced.
We believe that crude prices will stabilize once there are concrete signs that supply is being curtailed, demand is not falling due to economic weakness, and OPEC (Organization of the Petroleum Exporting Countries) market share appears to steady. This is increasingly looking like it will not occur in the first half of 2015. Domestic production and weekly inventories are likely to climb in the first half of the year based on IEA estimates and company presentations. While the IEA does not believe supplies will be curtailed in the near term, at some point capital spending by the upstream and a sharp cut of domestic rig counts will eventually lead to reduced supply. Several surveys completed in December 2014 when oil prices were 10% – 15% higher than they are today, suggested that capital spending by independent and integrated companies (the upstream) would decline by 25% to 30% in 2015 and evidence of these capital cuts are reflected in falling rig counts. The major oil producing shale regions in the U.S. have experienced less activity in recent weeks, as the drilling rig count has declined by 9% to 870 rigs. We expect these rig counts to decline sharply in the early part of 2015. Similar reductions took place in 2009, 1998 and 1986 when the domestic oil rig counts declined by 57%, 75% and 63%, respectively. These painful cuts, especially for the oil field service sector, are necessary to reestablish a balanced crude oil market.
There are unfortunately very few timely data points to estimate current crude oil demand. As a result, outside of the IEA’s estimated demand for December, it is difficult to forecast what impact lower crude prices have had on demand. Two data points are somewhat encouraging. First, estimates for U.S. consumption, which are available through January 2015, indicate demand has increased 4% – 5% year over year. Secondly, China’s Customs General Administration reported December crude oil imports increased 20% from November and demand for crude increased 3% year over year. We expect year over year consumption to increase due to low oil prices; however, it is too early to declare the increase is a worldwide trend.
A third item that we believe should contribute to stabilized prices is OPEC market share above 29 million barrels per day. Currently, OPEC expects demand for its crude may be less than that amount in 2015, which is obviously concerning to the cartel. Given commentary from OPEC oil ministers in recent months, we believe the market fears that this sell-off in crude could resemble the 1986 environment when OPEC flooded the market with oil. In that period, OPEC and particularly Saudi Arabia started to defend its market share, increasing production by an incremental 4 million barrels per day or 10% of supply. This caused prices to decline 67% over four months. At that time, OPEC was attempting to defend its market from producers in the North Slope of Alaska, the North Sea and Mexico.
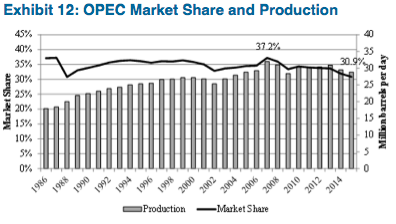
OPEC’s actions and guidance in the past several quarters (no production cut in November 2014; Iraqi production increase in December; Saudi Arabian energy minister stating that whether oil goes down to $20, $40, $50, $60, it is irrelevant; Iranian oil minister sees no threat from $25 oil; United Arab Emerits (UAE) oil minister says market may take years to absorb oil glut; Kuwait minister says no need to cut) have successfully reduced prices in hopes of weeding out higher cost producers. OPEC began to engage in this type of rhetoric shortly after the U.S. began to allow crude exports for the first time in nearly 40 years. It seems reasonable that OPEC is concerned that additional shale production and a new U.S. export policy could contribute to further market share erosion of the cartel’s dominance. As Exhibit 12 shows, demand for OPEC crude is expected to be about 10% below its 2007 peak, despite crude consumption reaching an all time high of 93 million barrels per day.
While the situation does appear somewhat similar to 1986, the actions in 2014 and 2015 have been much more benign relative to that period. Total OPEC crude oil production was essentially flat in the past year, which is very different from 1986 when production increased by 4 million barrels or about 10% of supply. Yet, prices have reacted downward by nearly the same magnitude.
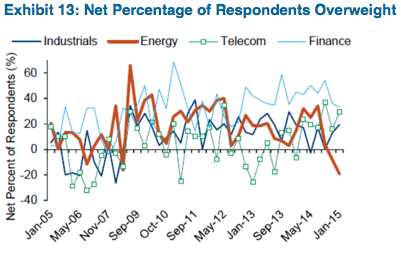
The largest subsectors of the Energy sector (Independents, Integrateds, Oil Field Services and Midstream) are trading at 5 year Z-scores between 1.0x and 4.0x wide of Industrials, which reflects that the market has already taken into account the affect weak oil prices will have on the risk profiles of the companies in the energy sector. As Bank of America Merrill Lynch notes in Exhibit 13, the net proportion of investors that are now underweight Energy is at its highest point since 2005. Given this information and our view that prices should stabilize in 2015, we do not believe investors should be broadly reducing their exposure to Energy. In the sector outlooks later in this paper, we highlight our relative value views of the different subsectors.
Europe
Europe remains a key factor in determining market performance in 2015. We remain cautious on Europe, both as a destination for client investments and as a catalyst for volatility in broader markets. The European Union (EU) remains mired in low-to-negative economic growth and desperately in need of continued structural reforms to labor markets and tax/regulatory regimes. However, the political willpower to implement painful structural adjustments remains uneven (present in Spain, elusive in Italy and France). Although the European Central Bank (ECB) is engaging in quantitative easing (QE) in a bid to stave off outright deflation, such an approach is likely more beneficial for asset markets than for economic growth.
In the mean time, the EU faces rising political opposition in numerous member states to EU centralized control and the austerity imposed by the common budget rules (e.g., 3% deficits/60% debt-to-GDP). The most obvious examples are the risks of a Greek debt restructuring (or exit) and the promised UK referendum on continued EU membership. However, the growth of populist anti-EU parties such as the National Front in France and Alternatives for Germany highlights growing macro political risks in the core of the EU.
Market Technicals
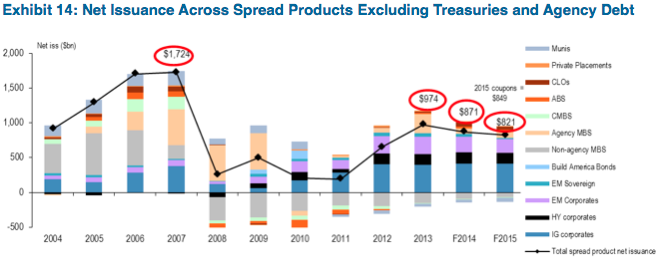
Gross investment grade corporate bond issuance for 2014 totaled $1 trillion. That is a 9% increase versus 2013 and remains heavy versus historical standards, exceeding the five year range of $680 to $930 billion (Exhibit 14). In addition, the year end total was 12% above the original estimate for 2014 of $900 billion. The higher-than-expected year end figure is attributed to higher-than-expected issuance from the Financial sector. Financial issuance increased 24% to $416 billion. At the beginning of 2014, Financials were expected to issue only $315 billion. The sub-sector driving issuance in Financials was Yankee Banks, and more specifically European Banks. European Bank issuance increased 49% in 2014 to $82 billion while Yankee Banks overall increased 29% to $188 billion. For 2015, Financials are again expected to be the main driver of issuance overall. Financials are expected to increase 11% to $460 billion driven by an increase in U.S. Banks of 16% to $175 billion. The increase in U.S. Bank issuance is attributed to changes in bank regulation which call for more loss-absorbing capital which may lead to more issuance of senior and sub bank paper at the holding company level.
Overall for 2015, we expect gross investment grade corporate bond issuance to increase approximately 5% to $1.05 trillion. Other than increased issuance from the banking sector, we also expect issuers to take advantage of low rates, particularly in the first half of 2015, as the Fed is expected to start raising rates after midyear. In addition, the Mergers and Acquisitions (M&A) cycle should continue bringing along deal-related issuance. Within the total, we expect Non-Financials to be basically unchanged at $590 billion. Within Non-Financials, we expect increases from sectors such as Basics +17%, Consumer +34%, and Telecoms +41%. However, two of the largest sectors are expected to slow. We expect Energy to decrease 15% and Healthcare/Pharmaceuticals to decrease 8%. Lastly, we expect Utilities to increase 8% to $58 billion. Issuance could surprise to the downside if companies look overseas to take advantage of lower yields (e.g., AT&T’s recent bond issue in Taiwan).
From the demand side, we expect insurance and pension investors to continue to be consistent buyers of investment grade debt with the potential for increased buying if yields rise meaningfully. Positive net issuance in corporates provides the product they need versus low to negative net issuance in other spread sectors and a challenging secondary market. The inventory of investment grade corporate bonds with maturities greater than thirteen months ranged from $3-16 billion last year. Bid/ask spreads have remained relatively orderly since the financial crisis, but we have seen bouts of volatility due to the constraints placed on dealer balance sheets, preventing them from acting as buffers when investors are looking for liquidity.
Along the yield curve, we are approaching 2015 with a more cautious point of view relative to last year. Considering our outlook for modest corporate bond performance and the continuation of the current low yield environment, we currently prefer the short and intermediate areas of the spread curve. Long end corporate bonds are not attractive due to their high dollar prices, low breakeven points, and wide bid/ask spreads, which are especially troubling at this point in the credit cycle.
SECTOR OUTLOOKS
Industrial companies are facing new challenges this year with slowing emerging market growth, a stronger U.S. dollar, and for some, much weaker commodity prices. Due to the global diversification of investment grade issuers, even companies that benefit from lower crude prices will be stung by one of the aforementioned challenges. AAM expects companies largely exposed to the U.S. to outperform, such as those in the Environmental Services, Midstream, and Railroad sectors. Similarly, those sectors reliant on optimistic U.S. consumers and small businesses should do fairly well, namely Auto, Retail, Banks, and Insurance.
We expect crude and metals prices to remain volatile over the near term, pressuring companies that rely on capital spending, such as Metals & Mining, Construction Machinery, Diversified Manufacturing, and Oil Field Services. We acknowledge the significance of Energy and crude prices in particular to performance for the Corporate sector overall, and believe the risk of ratings downgrades is largely priced into the Energy Integrated and Independent subsectors. Conversely, bonds issued by utilities exposed to commodities, such as unregulated operating companies and holding companies, have not widened to the degree of their Energy counterparts.
Sectors where credit selection is of the utmost importance due to unique challenges include: Aerospace/Defense, Media, REITs and Technology. Lastly, we remain concerned with creditor unfriendly event risk and/or shareholder activism, expected to plague sectors such as Chemicals, Consumer Products, Food & Beverage, and Telecommunications.
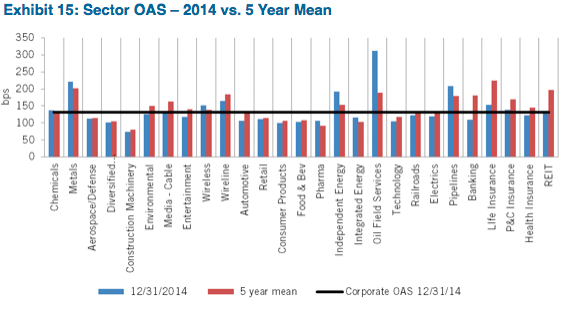
In summary, we believe growth challenged sectors will underperform those more exposed to the domestic economy and consumer, and believe the financial sectors have a little more room to run before the cycle hits bottom (Exhibit 15). The following highlights AAM’s analysts’ views regarding various subsectors for each broad category.
INDUSTRIALS
Basic Industries
Chemicals (Fair)
Event risk is high for this sector given special attention from shareholder activists (i.e., DOW, DD), mostly pressuring companies to sell/split assets vs. materially levering the balance sheet. Consequently, we do not expect credit improvement will become a near term priority. The cost advantage for those companies domiciled in the U.S., and benefitting from lower gas prices, is shrinking due to the fall in crude prices. The sector’s OAS is close to its five year average, which seems appropriate at this point in the cycle.
Metals & Mining (Unattractive)
Metals & Mining had a tough 2014, as commodity prices plummeted in the last quarter of the year. Most analysts agree that the fall was largely supply driven, brought on after years of record capital spending. Excess capacity and inventories will need to be worked off before prices for most of the base metals can recover. Slowing capital projects and signs of better global growth should improve the economics of the sector. We would expect those credits that have levered up recently to sell non-core assets or extend capital expenditure (capex) to conserve cash flow. Some may be forced to issue new debt to fund the shortfalls. All eyes will be on China with the risk of GDP growth falling below 7% for 2015. Also, lower oil prices seem to be dragging metals lower given broader based commodity index selling by investors, likely to remain an overhang over the near term. Positively, cheaper oil will improve the cost structure for miners, resulting in equal profitability at lower prices. On the flip side, a better cost structure may extend the timeframe for metals prices to recover. Spreads could continue to widen if pricing does not stabilize or takes a leg down. We will look to production numbers and economic data to help predict a turn in base metal pricing.
Capital Goods
Aerospace/Defense (Fair)
This sector was very quiet last year. M&A activity was low, debt issuance was limited and increased free cash flow was used to satisfy shareholders. We would not expect prospects for the sector to change. Defense spending continues to trend down while demand for commercial aerospace remains strong. The sector has low leverage and sizable cash positions. We continue to expect event risk in the sector, although large scale M&A might be difficult. Spreads are tight relative to other Industrials.
Diversified Manufacturing (Unattractive)
We believe this environment of slow growth, low interest rates, and a strong dollar invites shareholder activism. We expect companies to seriously contemplate splitting up their assets to promote higher equity valuations. In addition, we could also see large scale M&A for the higher quality credits. While we don’t expect large moves down in ratings, credit fundamentals are not expected to improve. Companies with exposure to autos, trucks, and/or construction should benefit from positive growth trends in 2015. This sector’s duration adjusted OAS is the tightest among Industrials.
Construction Machinery (Unattractive)
Fundamentals should deteriorate as top line prospects dwindle. The newly evolved low commodity environment will translate into lower production from customers (metals & mining companies, oil & gas) and fewer opportunities. One area of growth is expected to come from the building construction segment in the U.S. Companies are large, highly rated, and globally diversified. This weighs against very tight spreads with risk of spread widening.
Environmental Services (Attractive)
Pricing and volume growth are projected to be in the low single digits this year. The sector should move in tandem with the overall growth of the U.S. economy, which is slightly improving. We consider the sector as “utility like” given its business characteristics and diversified customer base. Spreads should tighten when compared to other low-beta sectors. Exposure to the oil industry remains low and should not significantly impact financial results.
Consumer Discretionary
Autos (Fair)
North American SAAR (Seasonally Adjusted Annual Rate) grew 5.8% in 2014. We expect to see a similar growth pattern this year given low crude prices (could result in a more positive mix of sales), strong new product, attractive credit, and improving economic conditions. We should continue to see a focus on connectivity, safety, and fuel economy. We would expect more aggressive promotion if management teams become overly optimistic.
Retail (Fair)
In general, Retail is a stable sector, dominated by several very large, highly rated companies. This sector is very competitive and subject to dynamic changes in consumer shopping trends. A company needs to be a strong operator and forward thinking to win market share. We look for those kinds of stories (i.e., Kroger and Macy’s) while focusing on specific subsectors (i.e., Drug Retailing) in order to take advantage of cyclical or secular developments. Cheap gas, improving economic conditions, and low borrowing rates should continue to bolster consumer confidence. We expect online retail to remain a key focus for companies given high growth rates and increasing overall importance. In addition, we believe pricing will be competitive especially around key holiday shopping days. We could see slight tightening in spreads given lower event risk and higher quality attributes of the sector, which would help offset the relative lack of income provided to bondholders.
Consumer Nondiscretionary
Consumer Products (Unattractive)
This sector has exhibited stable margins and credit measures. We expect low single digit revenue growth for 2015, with outperformance coming from producers that are innovative and/or benefit from strong brand loyalty. These attributes are especially important to exports, as the dollar strengthens and emerging market growth weakens. In our opinion, M&A and shareholder activism is a foregone conclusion in the sector. There is significant spread widening and ratings downgrade risk given current ratings and tight spreads relative to other single-A rated Industrials.
Food & Beverage (Unattractive)
Most of the credits in this sector are well known companies with large market shares and strong credit characteristics. Nonetheless, the low growth environment globally is troublesome for management, and share buybacks and increased dividends are getting tiresome. We may see a mega merger or two in the sector this year, and activist involvement would not be a surprise. We prefer the companies that are well diversified, manage tier-1 brands, and spend money on product innovation and research. Spreads are historically tight and susceptible to modest widening given our expectations of increased volatility.
Pharmaceuticals (Fair)
The Pharmaceuticals sector was riddled with event risk in 2014. Everything from large scale acquisitions to shareholder activism increased spread volatility in this historically defensive sector. We expect more of this in 2015, but probably to a lesser degree. In general, the sector is high quality, exhibiting large amounts of cash flow and benefiting from strong secular trends in healthcare. We expect M&A this year to remain heavy. Spreads could tighten modestly, as the sector’s OAS is one of the few sectors to be wide of its five year average. Having said that, we expect a lot of new issue supply this year given last year’s activity and significant maturities. We think buying on new issue is a good strategy for this sector.
Energy
Independent (Fair)
The fundamental outlook for Independent oil and gas companies is negative. In the first half of the year, independents will generate weaker revenue, margins and cash flow due to weaker oil and natural gas prices. In the second half of the year, we expect production to decline due to the previously mentioned capital spending cuts, which will also hurt revenue and cash flow.
The OAS of the Independent subsector is currently 208 bps, which is 1.9 standard deviations wide of its five year average. The subsector index is currently trading at 141% of Industrials, which is 3.8 standard deviations wide of its five year average. While these figures are alluring, we believe the prudent action is to wait for stability in oil prices before becoming more aggressive, especially with weaker investment grade names. We believe the sector is fairly valued.
Integrated (Fair)
The fundamental outlook for Integrated oil and gas companies is negative, but not to the same degree as the Independent subsector. In the first half of the year, Independents will generate weaker revenue, margins and cash flow due to weaker oil and natural gas prices. In the second half of the year, we expect production to decline due to the previously mentioned capital spending cuts, which will also hurt revenue and cash flow. Partially mitigating this weakness should be the strength of their refining operations. Refiners should see increased demand for their products (gasoline, diesel, jet fuel) due to lower prices. Additionally, their primary input – crude oil, is obviously much lower. Importantly, we believe this group of high quality companies may take advantage of low equity valuations to pursue weaker quality energy companies.
The OAS of the Integrated subsector is currently 124 bps, which is 0.9 standard deviations wide of its five year average. The subsector index is currently trading at 84% of Industrials, which is 1.1 standard deviations wide of its five year average. Due to volatile commodity prices along with potential acquisition risk, we maintain our fair relative value opinion on the sector despite the wider OAS.
Oil Field Services (Unattractive)
The fundamental outlook for Oil Field Service (OFS) subsector (includes contract drillers) is negative. Oil field service companies and contract drillers derive their revenue from the capital spending by independent and integrated companies. As we mentioned previously, we expect capital spending by independent and integrated companies to decline by more than 30%, which will lead to weaker revenue, margins and cash flow for both the service companies and drillers. Furthermore, the contract drillers are under additional pressure due to a substantial amount of new drilling rigs entering the market over the next 24 months. Downgrades are expected for the vast majority of the sector, particularly the contract drillers. Several companies from this subsector, including Nabors Industries, Noble Corp., Transocean Ltd. and Weatherford International, are at risk of losing their investment grade ratings if weak commodity prices and deflated upstream capital budgets linger.
The OAS of the OFS subsector is currently 377 bps. Excluding companies listed above that are at risk of falling to high yield, the OAS of the sector is 230 bps, which is 0.9 standard deviations wide of its five year average. The subsector index is currently trading at 155% of Industrials, which is 1.0 standard deviation wide of its five year average. We maintain our unattractive relative value opinion on the sector.
Midstream (Attractive)
The fundamental outlook for the Midstream subsector is stable. Most midstream companies should benefit from a healthy domestic economy, which should ensure demand for crude oil, natural gas and the byproducts of each remains strong. Additionally, many of the midstream companies only have indirect exposure to commodity price swings, which should help insulate their revenue, margins and cash flows. Offsetting these positives is the fact that the credit quality of their front end customers (the Independents and Integrateds) will deteriorate, some to the point of default for certain operators rated below investment grade.
The OAS of the Midstream subsector is currently 217 bps, which is 1.2 standard deviations wide of its five year average. The subsector index is currently trading at 147% of Industrials, which is 2.3 standard deviations wide of its five year average. We maintain our attractive relative value opinion on the sector.
Communications
Telecommunications (US: Fair, Europe: Unattractive) / Media Cable (Unattractive)
2014 marked a year of surprises in the U.S. Telecom and Cable sector. Comcast surprised the market with a bid for Time Warner Cable (TWC), allowing TWC bonds to be the top performer for the year. This year’s performance may once again be determined by the outcome of this merger, as the probability of it closing continues to fall due to the challenges facing the deal. AT&T also surprised with the acquisition of DirecTV and two Mexican wireless operators, raising the possibility of additional acquisitions and investment in Latin America. Verizon and AT&T are expected to be issuing multi-billion dollar deals in the next month or two to fund spectrum purchases. We believe their strategies hinge on video over wireless, with companies expecting to launch multicast services later this year. Not only will this service allow the duopoly to continue, it has the potential for wireless carriers to capture a piece of the advertising market. The other source of future revenue is the “Internet of Things,” a popular topic at this year’s Consumer Electronics Show. Wearables and connected devices such as our cars and home will become increasingly more popular.
Our fundamental credit outlook is stable for domestic telecommunication and cable companies, but it is moving towards negative, as companies are assuming more debt to satisfy shareholders and pursue M&A when margins are under pressure due to increased competition. We prefer Verizon to AT&T with investment demands increasing at a time when domestic competition is intensifying. We also prefer Comcast’s fundamental trajectory to Cox Communications and other pure play video distributors. We believe cable bonds offer little value to investors (10-year Z score for OAS vs. Industrials approaching -2), and prefer waiting for new issue to invest in the large telecom providers. The Telecom and Cable sectors are vulnerable to spread widening when the credit cycle bottoms, as they include some of the most liquid bonds, which are used as trading vehicles if investors reduce Corporate bond exposure.
European communications providers are expected to remain busy with M&A, as consolidation is necessary for financial stability. We remain selective in Europe, avoiding most operators as we expect negative revenue growth and margin compression to continue and/or leverage to increase to fund acquisitions and capital investment. Our fundamental credit outlook is negative, and relative value opinion is unattractive.
Media Entertainment (Unattractive)
We anticipated increased M&A activity among television network companies in reaction to the consolidation occurring among the video distributors. After the failed merger attempt by 21st Century Fox (Fox) of Time Warner Inc, we saw very little. We continue to believe consolidation is necessary not only because of the pressure network companies will receive from the distributors but because original programming (especially sports) is getting increasingly more expensive, favoring scale. Moreover, technology and new entrants have started to disrupt their business models, which rely on cable companies to continue to pay more for content and corporations for television advertising. U.S. television advertising was weak this year despite a relatively constructive macroeconomic environment, highlighting the secular pressures.
Domestic advertising revenues are more than 10% lower than their peak in 2007, as the increase in television and digital has not offset the decline in traditional forms (newspaper, radio). Globally, television and internet growth has more than offset the declines, allowing global advertising revenues to exceed 2007’s level. We believe that is partly due to multinational companies moving advertising overseas, which we do not expect to change despite the slowing expected this year. Our forecast is for another lackluster year in television advertising given the cost pressures facing multinational companies and the continued shift to internet and mobile.
We believe content companies need to fight for better measurement and then explore different advertising mediums (e.g., Video On Demand (VOD)). Moreover, they need to get more inventive with their digital and mobile presence to effectively compete. Also, many cable networks are running episodes too many times, which will be a loser in this new regime of time shifted programming and competition from streaming providers such as Amazon and Netflix.
Our preference is to invest in media companies with large production studios, such as Time Warner Inc. and Fox. Although we expect companies like Discovery and Scripps Networks to remain active with M&A, we believe they will remain sensitive to their investment grade ratings. We do not have that same level of conviction for Sumner Redstone’s companies, CBS and Viacom. Our fundamental credit outlook is stable to negative for this sector with gradation increasing among companies. We do not believe spreads reflect the cyclical and secular risks facing entertainment companies today. A positive surprise would be an acquisition by a highly rated technology company such as Yahoo.
Transportation
Railroads (Attractive)
We expect the fundamentals for the sector to improve. Volumes will continue to follow improving economic conditions in the U.S., and pricing should remain strong as secular factors remain positive and service levels improve. Capital spending is expected to grow and share buybacks will continue. Bond market technicals remain strong given the relative illiquidity of the bonds and fairly stable debt issuance. We expect ratings to continue to trend higher and M&A activity to be low. This sector already trades like a single-A; therefore, we expect income to drive performance more than spread tightening.
UTILITIES
Electric (Fair)
We view the fundamentals of the Electric sector as being mostly stable and have a fair relative value opinion of the sector. Positively, regulated utilities and diversified electric companies are expected to continue to invest in regulated businesses and reduce exposure to non-regulated businesses. However, most unregulated companies within the sector (generation companies) should experience weaker cash flows due to lower electricity prices and lower volumes. Recall that in many regions, natural gas burning power plants set the marginal price for power, especially in deregulated markets such as Texas and Illinois. Therefore, lower natural gas prices will result in lower electricity rates in 2015. Compounding this problem is the fact that energy conservatism continues to negatively affect residential and commercial demand. As a result, revenues and cash flows for unregulated generation companies should deteriorate in the upcoming year. We base our fair relative value opinion on this relatively benign risk profile combined with how the sector is trading relative to other stable industrial components, such as Rails (attractive).
FINANCE
Banks (Fair)
Our bank outlook for 2015 is balanced, bolstered by modestly positive fundamentals. Capital, liquidity and asset quality remain at cycle highs. Modest loan growth is weighted toward Commercial and Industrial (C&I) and Commercial Real Estate (CRE) lending, and expanding balance sheets are generally offsetting compressing asset yields. Bank balance sheets remain highly asset sensitive in anticipation of rising interest rates, but an acceleration of earnings is unlikely to occur before rates begin rising. Balancing out these positives, Fed surveys highlight a multi-quarter trend in loosening lending standards that generally characterizes the top of the credit cycle. While we do not expect a downturn in asset quality to manifest in 2015 given the still positive GDP trajectory, we believe that the seeds of future credit costs are being planted today. In addition to the longer-term prospect of increasing credit costs, we expect capital markets earnings to remain muted for the universal banks and brokers.
Balancing the positive fundamentals, there are two technical factors that may act as a headwind. First, is the prospect of increased issuance from those banks designated systemically important financial institutions by the Fed in order to meet Total Loss Absorbing Capacity (TLAC) requirements. Second is the likelihood of downgrades by the rating agencies as they adjust their bank rating methodologies to reflect the advent of bank resolution regimes (Orderly Liquidation Authority – OLA) imposed by the Dodd-Frank Act. While the actual rules governing TLAC and OLA have not yet been made public, we expect a Notice of Proposed Rulemaking from regulators during 2015. As a result, we expect spreads to be flat-to-modestly wider over the course of the year. We are forecasting modest excess returns generated largely by carry.
The domestic banking sector’s exposure to the Oil & Gas industry appears modest and well managed through year end 2014. Based on discussion and disclosure by bank management teams during quarterly earnings calls, direct credit exposure equates to 2-5% of balance sheet for the majority of banks in which we invest. Furthermore, such exposures are overwhelmingly to investment grade borrowers. For the moment, none of our portfolio companies have experienced meaningful credit costs or delinquencies. While we expect banks to be proactive in managing Oil & Gas exposures, we are focused on secondary effects; in particular credit deterioration of non-Oil & Gas commercial lending and commercial real estate portfolios in energy dependent geographies such as Texas and North Dakota. However, such deterioration is unlikely to manifest itself for several quarters.
Insurance (Attractive)
The credit outlook for the U.S. insurance industry is stable due to strong balance sheet fundamentals, ample liquidity, improved liability profiles, conservative investment portfolios and profitable operating performance. Industry earnings are expected to be positive but lower due to reduced underwriting profits and low portfolio yields. A significant equity market decline or an interest rate/inflation shock would cause negative industry credit conditions.
The credit outlook for the U.S. Life insurance sector is stable due to its strong liability profile, rational price competition in most products, and de-risking efforts. On the other hand, low interest rates continue to pressure life insurance company’s interest margins and reserve adequacy. Organic earnings growth is reliant on an improving economy.
The credit outlook for the U.S. Property and Casualty (P&C) insurance sector is stable due to solid earnings helped by rate increases and low catastrophe losses. P&C pricing may begin to weaken due to all-time high levels of industry capital, low catastrophe losses, and a soft reinsurance market. If severe catastrophe losses happen, the sector will undergo losses, but pricing should improve. M&A activity is picking up, which supports the view that P&C insurers face difficulty growing organically.
The credit outlook for the U.S. Health insurance sector is stable due to manageable business conditions and financial fundamentals. The sector appears to be successfully managing healthcare reform and has growth potential due to government privatization (Medicare Advantage and Medicaid outsourcing). Earnings could become more volatile due to greater competition and unexpected cost increases.
The U.S. insurance industry should outperform the high grade corporate index due to its slightly higher OAS and stable credit outlook. That said, if the credit cycle turns earlier than expected, we would expect this sector to underperform due to its slightly longer duration position.
Real Estate Investment Trusts (REITs) (Fair)
Following a year of strong operating performance, we are cautiously optimistic on the REIT sector for 2015. Despite being at the highpoint of the credit cycle, balance sheet leverage and fixed cost coverage remain lower than at this point in the last cycle. At the same time, operating results remain robust, with REITs exhibiting the ability to continue pushing rents without experiencing declining occupancy. At this point in the cycle, REITs are favoring development over acquisition, choosing not to pursue existing properties at compressed cap rates in competition with non-strategic investors (private equity, pension funds), although development commitments as a proportion of capitalization also remain reasonable. In fact, we note that many of the companies we invest in have been better sellers and we have also noticed a trend toward portfolio simplification. Capital markets remain supportive, but we have noted an influx of first time REIT issuers that may struggle to retain investment grade ratings in future downturns. We have been, and remain, very selective in our investments in the REIT space. But, we view the sector as continuing to offer good relative value. We expect spreads to be range-bound in 2015, but believe that carry offers positive excess return potential.
STRUCTURED PRODUCTS
For the second year in a row, Structured Product securities provided relatively lackluster returns and did not significantly drive portfolio performance in 2014. Most sub-sectors struggled to earn their yield spread above Treasuries as markets dealt with the challenges presented by the end of Federal Reserve purchases of agency mortgage backed securities and the rising uncertainty surrounding the timing of interest rate hikes. As we look to 2015, many of these same challenges remain and we continue to be cautious about the investment prospects for the sector as a whole.
Residential Mortgage Backed Securities (RMBS)
For Agency RMBS, 2014 was a transitional year as the Fed brought its QE3 purchasing program to a close. Security valuations under the program became distorted due to the exceptionally large size of the purchases relative to the size of the market. Last year alone, these purchases amounted to $ 228 billion which accounted for more than 2.6x the supply of new mortgage backed securities issued last year, after adjusting for pay downs. The Fed’s mortgage portfolio now stands at $1.7 trillion which represents approximately 39% of the outstanding universe of agency RMBS and a whopping 52% of the outstanding supply of 30-year agency mortgages.
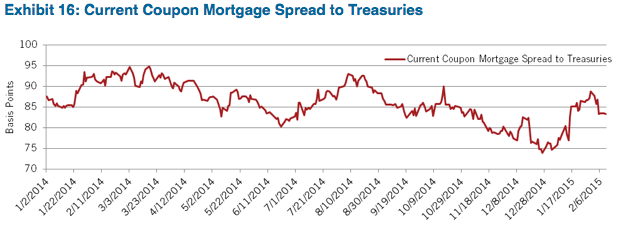
The impact of those purchases can be seen in the difference in yield between the current coupon mortgage backed security and U.S. Treasuries in Exhibit 16. Yield differentials remain near recent lows, 76 bps as of year end, and yet we are entering a period in which the Fed will be exerting much less influence over the market. It seems pretty clear that there is a high probability that we’ll see wider mortgage spreads in the months ahead. For comparative purposes, consider spreads in 2012 before the Fed announced the QE3 program, but after the completion of QE2: the spread differential between the current coupon mortgage and Treasuries averaged 117 bps. That time period is most comparable to current market conditions, in that Fed activity at that time was limited to the reinvestment of pay downs from its portfolio, as it is today.
As unattractive as yield spreads currently appear, there are factors that could temper any significant increase in yield spreads between Agency RMBS and Treasuries. The most important and likely of those factors is the probability that the Fed could begin to raise interest rates later this year. In prior periods, as the Fed tightens, mortgage backed securities have historically outperformed U.S. Treasuries. One reason for this is that the yield curve traditionally flattens during the tightening cycle which provides a big boost to mortgage backed security performance. A steep yield curve penalizes amortizing securities like RMBS at the expense of bulleted cash flows like Treasuries. A flattening curve reduces this penalty. Additionally, as rates rise, fewer new mortgage loans are created, making for a more favorable technical environment.
As we enter 2015, AAM mortgage holdings are at their target level. If we see an appreciable widening of mortgage security spreads, we will look to increase our positions utilizing specified pass-through pools. We favor pools with low underlying loan balances, originated in low turnover states such as Texas and New York and issued by large servicers such as Wells Fargo. Pools with these characteristics tend to prepay more slowly and consistently than the broad mortgage universe as a whole, earning much higher yields than TBA securities.
Commercial Mortgage Backed Securities (CMBS)
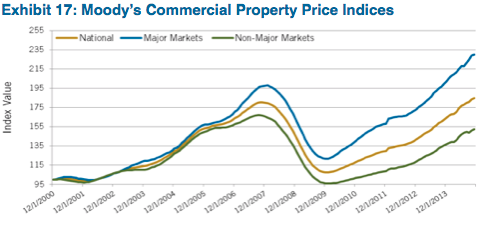
Riding an ever improving commercial real estate market in 2014, CMBS was the top performing sub-sector of the Structured Products universe last year. We anticipate many of the favorable conditions of the last few years continuing into 2016, fueling another strong year for CMBS returns. While we still like select conduit transactions, our top picks continue to be low leverage, single property deals in primary markets.
Commercial property valuations continued to soar following the bottoming of the market in 2008. The rebound in property values, however, has been somewhat uneven since then. Property prices in primary, urban markets as measured by the Commercial Property Price Index (CPPI), (see Exhibit 17), have rebounded past the peak property values established in 2006, posting record levels while the secondary markets are just now returning to levels seen before the crisis. This differential reflects the strong demand for primary market; Office and Multifamily space by domestic and foreign investors and can be directly attributable to the very strong rent increases realized over the last few years. Looking at the outstanding universe of conduit loans, property cash flows improved by 3.3% in secondary markets, but have been increasing at a 5.6% rate in the primary markets. We believe that the primary commercial real estate markets will continue to outperform the secondary markets in 2015.
Delinquency and loss rates on conduit CMBS continues to fall as strong property fundamentals and abundant capital has made it relatively easy to acquire and finance commercial real estate. Competition to make new loans continues to increase, resulting in a loosening of underwriting standards where the use of interest only loans and generous use of optimistic pro-forma forecasts of operating cash flows are once again the norm. Over the last five years, average conduit rating agency stressed loan to value ratios have risen from 82.6% to 108.1% while the average concentration of full term interest only loans has increased to 20.0% from less than 10% in 2010. Caution is warranted.
From a valuation perspective, CMBS still appears attractive to us. Despite our concerns about underwriting discipline, fundamental credit trends still support future improvement in commercial real estate operating metrics. Alongside a very favorable technical outlook where maturing and prepaying loans of $85 billion should offset this year’s anticipated supply; we anticipate no new, net supply of conduit securities this year. This should support valuation throughout the year and we anticipate that CMBS yield spreads to Treasuries should decline. Given our preference for conservatively underwritten properties in primary markets, we’ll continue to favor single property transactions in major metropolitan areas and will pursue conduit transactions to the extent that we can find securitizations where the concentration of risky loans and secondary market properties are minimized.
Asset Backed Securities (ABS)
Non-mortgage consumer credit has continued to perform quite well in the aftermath of the financial crisis. While the sharp drop in oil prices should provide a nice cash bonus to the consumer, we do expect credit metrics to begin to show some sign of weakness after the rapid improvements over the last 5 years. Consumer lending, has become more borrower friendly, however not excessively so, such that any expected erosion in credit measures should be modest.
While we remain quite constructive on ABS for their stable cash flows and high credit quality, the short duration and relatively low yields of the sector, prevent them from driving portfolio performance in a meaningful way. For short and intermediate maturity portfolios with higher quality requirements, however; we find ABS to be a superior investment alternative to high coupon RMBS and high quality, short corporates. Our credits of choice are auto loans, dealer floorplan and credit card securitizations.
MUNICIPALS
2014 Review
The Tax-Exempt sector enjoyed very strong performance in 2014. Yields for 10-year maturities fell by 73 bps and the yield curve from 2 to 30-years flattened by 148 bps, resulting in the Barclays Municipal Bond Index producing a return of 9.05% for the year.
Overall demand for the sector saw a dramatic rebound from 2013. After mutual funds recorded outflows of $68 billion during 2013, 2014 produced inflows in excess of $25 billion, with the majority of the money funneled into intermediate term funds. Demand also received a boost from investors seeking to capitalize on the higher tax-equivalent yields afforded Tax-Exempts due to the 24% increase in the highest tax-bracket that went into effect at the beginning of 2013. This rate increase effectively raised the top rate to 43.4%, after considering both the 39.6% top marginal rate and the 3.8% Medicare surtax on investment income.
Very favorable supply technicals also kept downward pressure on yields all year. Yields in 10-years started the year 105 bps higher than at the start of 2013 and the higher rate environment effectively siphoned off much of the refinancing opportunities for municipalities. Consequently, the first three quarters of the year experienced a supply cycle that was running approximately 20% below 10-year historical norms. The low issuance cycle, combined with the strong pent-up demand, led municipal tax-adjusted spread relationships to remain tight versus Treasuries for most of the year.
However, the market experienced a much heavier supply cycle during the fourth quarter that was approximately 30% or $24 billion above expectations. The heavy issuance was met with strong demand flows, and yield levels fell by 1 to 25 bps, 7-years and longer. However, this supply provided enough of a headwind that municipals underperformed Treasuries. Nominal yield spread relationships between Tax-Exempts and Treasuries widened across the curve by 12 to 25 bps, with the weakest performance concentrated in the 5 to 11-year area of the yield curve. During the first five weeks of 2015, supply has continued to surprise to the upside, with supply during January coming in 42% higher than expectations.
The primary catalyst for the increase in new issuance was due to a substantial rise in refinancing/refunding activity. With 10-year Treasury rates falling by 86 bps over the course of 2014, in part, on global growth concerns, average 10-year Tax-Exempt yield levels during the fourth quarter fell to 2.07%. With U.S. economic growth still exhibiting a sluggish upward trend, municipalities continue to see slow growth in revenues and remain focused on austerity measures, which include reducing borrowing costs. Consequently, the low rate environment led to straight refinancing volume during the fourth quarter to surge by 86% relative to the same period in 2013, leading overall supply higher by 28%. Since year-end, 10-year municipal rates have moved lower by an additional 9 bps, which will continue to support the trend toward additional refinancing borrowings during the first quarter.
2015 Outlook
In looking at the outlook for 2015, the market is not expecting a drastically different technical environment from 2014. Most of the estimates for new issuance volume are in line with issuance levels over the last two years of approximately $334 billion. Infrastructure-related financing is estimated to see a modest increase over 2014’s levels of 6% to $152 billion. That would be very close to the average over the last four years of $150 billion, but remain 38% or $94 billion below the long-term average between 2004 and 2010. As we’ve pointed out in prior commentaries, municipalities continue to experience slow revenue growth. The combination of this slow growth, along with some crowding-out effects of more pressing budget issues like pension financing, has reduced budget flexibility and does not leave issuers much room to increase debt service costs for infrastructure financing. Additionally, a number of states have already felt the budget pressure from oil prices falling by over 50% since June of 2014. The states with the highest levels of oil production (TX, ND, AK, OK, and NM) have exhibited solid budget reserve levels to absorb the drop in oil-related revenues, but the budget pressure will likely exacerbate the already austere focus for these states and further curtail new spending initiatives.
In terms of refinancing volume, estimates for 2015 are for this category to come in slightly below 2014 levels by 10% to $113 billion. This target would generally be supported by a higher rate environment, which is expected if the Fed embarks on tightening monetary policy sometime in the second half of the year. However, the consensus estimates for refinancings could be revised sharply higher if interest rates remain near current levels for most of the year. Under this scenario, volatility in relative valuations would likely see a dramatic change from the relatively stable environment that existed during 2014. Most of 2014 was marked by a supply cycle that ran below 10-year historical levels by 20%, due in large part to a higher interest rate environment in the first half of the year that made refinancings unattractive. The favorable supply technicals, combined with consistently solid demand flows, kept municipal tax-adjusted spread levels to Treasuries in a tight trading range for most of the year.
That dynamic could change pretty drastically in the first half of the year. We’ve already witnessed a substantial pickup in new issuance volume due to refinancings over the last quarter of 2014 and January is already running ahead of expectations. Although the market has done well in absorbing this supply with strong demand flows from reinvestment of coupons/calls/maturities that’s particularly strong at this time of year, the March to June period typically exhibits a much weaker technical profile. New issuance typically spikes during these months as financing of finalized budget initiatives are addressed, while demand softens from both a dramatic drop in reinvestment flows and selling by retail investors to raise cash ahead of the tax-filing deadline. If this supply/demand imbalance is exacerbated by a continued surge in refunding activity, we could see relative valuation metrics move to very inexpensive levels versus taxable alternatives.
Although the market will see seasonal swings in demand technicals throughout the year, demand overall should continue to see similar flows as 2014. The Obama tax hikes that went into place in 2013 effectively increased the highest marginal tax rates by 24% when factoring in the addition of the Medicare surtax on investment income. These higher tax levels will continue to make after-tax yield levels for the sector attractive versus taxable alternatives, especially as yields rise. Additionally, mutual fund inflows have been generally solid for most of 2014. After experiencing a record $67 billion in redemptions in 2013, 2014 saw $25 billion in inflows, building to a four week average of approximately $400 million per week by the end of 2014. 2015 has already started off at a strong $1.3 billion in inflows during first week of January. Similar fund flows are expected as long as underlying credit fundamentals continue to see gradual improvement and head line risk remains muted. However, momentum in this category is likely to slow considerably as we move toward higher rates.
In reviewing relative valuations to start the year, municipal tax-adjusted yield levels versus Treasuries remain at fair value and a neutral weighting to the sector is warranted, especially given the heightened expectation that new issue supply could surprise to the upside during the next few months. Going forward, we expect to closely monitor interest rate levels throughout the year and any resulting supply/demand imbalances that could potentially develop. Our cross-over investment strategy is designed to take advantage of any increase in volatility in relative valuations and our nimbleness in executing this strategy should serve us well if a lower-than-expected rate environment persists throughout 2015.
NON-CORE SECTORS: HIGH YIELD AND SENIOR LOANS
The recent precipitous decline in the price of oil has resulted in weakness in all energy related assets and a risk-off mode across financial markets in general. This has also led to price pressures in the U.S. high yield market where energy sector bonds account for around 14%* of the market capitalization. Credit spreads for the energy sector widened 400 bps versus the broad high yield market in the second half of 2014 and ended the year with an implied default risk of approximately 10%. Such a default rate may occur if oil prices remain at current levels for several years. Near term, however, we do not expect a meaningful pickup in defaults. There is a lack of near term maturities and companies, in general, have ample liquidity on hand. Many also have 2015 hedges in place. If oil prices remain low, companies can be expected to reduce capital spending and also resort to asset sales. We have tried to be careful in our choice of credits and believe that our energy investments will be relatively well placed to withstand pricing pressures over time. It is interesting to note, however, that the futures market has gone from backwardation (future prices below spot) to contango (future prices above spot).
The broad U.S. High Yield market* registered a 161 bps increase in credit spreads in the second half of the year and ended 2014 year with an average yield of 6.54% which exceeds similar duration U.S. Treasuries by more than 500 bps. Those valuations imply a default rate of about 5% which offers a compelling risk reward profile in this environment.
* Bank of America Merrill Lynch US HY Cash Pay Index (J0A0).
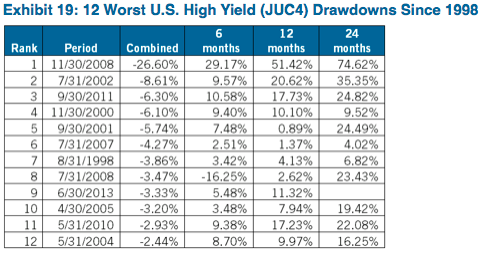
Given the recent weakness in high yield, we have examined the 12 worst drawdowns periods since 1998 in the BB/B US High Yield Index (JUC4) (either one negative month or a period of consecutive monthly returns) and index annualized forward returns (APR) in subsequent months (Exhibit 19).
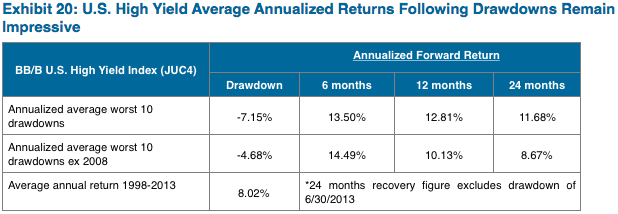
It’s interesting to note that out of the ten previous greatest drawdowns (e.g., 2008), all provided positive returns within six months. Average annual returns from 1998 to2013 were 8.02% (Exhibit 20). Recoveries have been strongest in the first six months and then tailed off, though two year returns still remained impressive.
There are many uncertainties facing investors. Not long ago when oil prices were considerably higher, the International Monetary Fund (IMF) expressed concern about geo-political tensions and how this could result in an increase in energy prices. We have recently witnessed a significant re-pricing in the high yield market due to falling oil prices and this may offer an investment opportunity.
We should not forget that lower energy prices are, in broad terms, a major positive for most economies. A stronger economy is generally good for companies and for the high yield market as a whole. This recent decline in high yield bonds has perhaps offered us an interesting opportunity to benefit from higher yields and an investment with attractive risk/reward characteristics. Insurance investors with longer-term views and stable sources of capital can be opportunistic whenever these disruptions occur by providing the buying power that bond dealers no longer offer. Accordingly, we recommend that insurance companies who are considering an allocation to below investment grade securities should address their guidelines and seek board approval well in advance so they are better positioned to take advantage of opportunities whenever they arise.
CONVERTIBLE SECURITIES
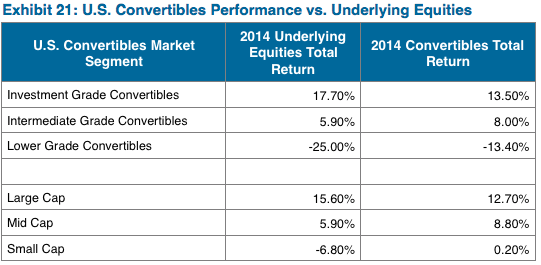
Equities were the primary driver of convertible returns in 2014 (Exhibit 21). Large cap/investment grade issuers outperformed small cap/lower grade issuers. Convertibles performed in line with expectations capturing a large portion of equity market advances while providing downside participation during the few periods when stocks declined. Large cap Technology and Healthcare sectors were strong performers throughout the year while the Energy sector underperformed due to a dramatic fall in oil prices.
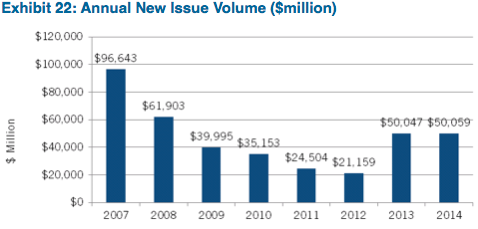
U.S. Convertible new issuance surpassed $50 billion in 2015 for the second consecutive year and worldwide issuance topped $90 billion (Exhibit 22). Furthermore, the size of the market expanded as new issuance outpaced redemptions for the first time since 2007. Primary market supply continues to come without credit ratings, as 74% of deal flow in 2014 was non-rated. Among rated issues, investment grade quality transactions represented 37% of supply. With the market expecting steady domestic economic growth, and on the heels of higher equity valuations, new issuance should be strong again in 2015. According to Barclays Research, the convertible market should experience organic growth in the year ahead as redemption activity is forecast to decline significantly to $33 billion.
Last year marked the sixth consecutive annual period of positive total returns for equity investors, as measured by the S&P 500, which has returned 156% since December 31, 2008. As a result of these steady, strong markets, a portion of the convertible universe has traded up to 2x par (or higher) and is, in effect, an equity surrogate. With Zazove’s focus on downside protection, our portfolios maintain a balanced risk/reward profile at all times.
Looking ahead, equity market performance is likely to continue as the primary driver of total returns for convertible securities, particularly within the investment grade universe. Zazove believes that a broadly diversified and balanced portfolio with convexity and yield provides the best opportunity for optimal risk-adjusted returns.
We continue to believe that the convertible securities asset class presents an attractive opportunity for insurance companies to gain exposure to equity markets with reduced volatility, higher current income, low duration, and favorable regulatory treatment.
Macro-Economic Review and Outlook Commentary Written by:
Marco Bravo, CFA
Senior Portfolio Manager
Core Fixed Income Outlook Commentary Written by:
Reed Nuttall, CFA
Chief Investment Officer
Corporate Credit Commentary Written by:
Elizabeth Henderson, CFA
Director of Corporate Credit
Michael Ashley
Senior Analyst, Corporate Credit
N. Sebastian Bacchus, CFA
Senior Analyst, Corporate Credit
Bob Bennett, CFA
Senior Strategist and Trader, Corporate Credit
Patrick McGeever
Senior Analyst, Corporate Credit
Hugh McCaffrey, CFA
Senior Analyst, Corporate Credit
Structured Products Commentary Written by:
Scott Edwards, CFA, CPA
Director of Structured Products
Municipals Commentary Written by:
Greg Bell, CFA, CPA
Director of Municipal Bonds
High Yield and Bank Loan Commentary Written by:
Scott Skowronski, CFA Muzinich & Co.
Senior Portfolio Manager
Convertible Commentary Written by:
Tim Senechalle, CFA
Zazove Associates, LLCSenior Portfolio Manager
For more information, contact:
Colin T. Dowdall, CFA
Director of Marketing and Business Development
colin.dowdall@aamcompany.com
John J. Olvany
Vice President of Business Development
john.olvany@aamcompany.com
Neelm Hameer
Vice President of Business Development
neelm.hameer@aamcompany.com
Disclaimers: Asset Allocation & Management Company, LLC (AAM) is an investment adviser registered with the Securities and Exchange Commission, specializing in fixed-income asset management services for insurance companies. This information was developed using publicly available information, internally developed data and outside sources believed to be reliable. While all reasonable care has been taken to ensure that the facts stated and the opinions given are accurate, complete and reasonable, liability is expressly disclaimed by AAM and any affiliates (collectively known as “AAM”), and their representative officers and employees. This report has been prepared for informational purposes only and does not purport to represent a complete analysis of any security, company or industry discussed. Any opinions and/or recommendations expressed are subject to change without notice and should be considered only as part of a diversified portfolio. A complete list of investment recommendations made during the past year is available upon request. Past performance is not an indication of future returns.
This information is distributed to recipients including AAM, any of which may have acted on the basis of the information, or may have an ownership interest in securities to which the information relates. It may also be distributed to clients of AAM, as well as to other recipients with whom no such client relationship exists. Providing this information does not, in and of itself, constitute a recommendation by AAM, nor does it imply that the purchase or sale of any security is suitable for the recipient. Investing in the bond market is subject to certain risks including market, interest-rate, issuer, credit, inflation, liquidity, valuation, volatility, prepayment and extension. No part of this material may be reproduced in any form, or referred to in any other publication, without express written permission.
Muzinich opinions and statements of financial market trends and outlooks constitute our judgment as of January 2015 and are subject to change without notice. The information in this document is intended to be, and should not be considered, investment advice.
Disclaimer: Asset Allocation & Management Company, LLC (AAM) is an investment adviser registered with the Securities and Exchange Commission, specializing in fixed-income asset management services for insurance companies. Registration does not imply a certain level of skill or training. This information was developed using publicly available information, internally developed data and outside sources believed to be reliable. While all reasonable care has been taken to ensure that the facts stated and the opinions given are accurate, complete and reasonable, liability is expressly disclaimed by AAM and any affiliates (collectively known as “AAM”), and their representative officers and employees. This report has been prepared for informational purposes only and does not purport to represent a complete analysis of any security, company or industry discussed. Any opinions and/or recommendations expressed are subject to change without notice and should be considered only as part of a diversified portfolio. Any opinions and statements contained herein of financial market trends based on market conditions constitute our judgment. This material may contain projections or other forward-looking statements regarding future events, targets or expectations, and is only current as of the date indicated. There is no assurance that such events or targets will be achieved, and may be significantly different than that discussed here. The information presented, including any statements concerning financial market trends, is based on current market conditions, which will fluctuate and may be superseded by subsequent market events or for other reasons. Although the assumptions underlying the forward-looking statements that may be contained herein are believed to be reasonable they can be affected by inaccurate assumptions or by known or unknown risks and uncertainties. AAM assumes no duty to provide updates to any analysis contained herein. A complete list of investment recommendations made during the past year is available upon request. Past performance is not an indication of future returns. This information is distributed to recipients including AAM, any of which may have acted on the basis of the information, or may have an ownership interest in securities to which the information relates. It may also be distributed to clients of AAM, as well as to other recipients with whom no such client relationship exists. Providing this information does not, in and of itself, constitute a recommendation by AAM, nor does it imply that the purchase or sale of any security is suitable for the recipient. Investing in the bond market is subject to certain risks including market, interest-rate, issuer, credit, inflation, liquidity, valuation, volatility, prepayment and extension. No part of this material may be reproduced in any form, or referred to in any other publication, without express written permission.