Executive Summary
In this paper we reexamine our 2019 thought leadership piece entitled, “Fixed Income as a Commodity: Debunking the Myth (Skowronski).” The goal is to see what, if anything, has changed in the intervening years.
In 2019, our analysis concluded that there is a distinct connection between the size of a manager’s assets and their portfolio characteristics which is ultimately reflected in their investment performance. The conclusion was that we believe managers need scale and resources to successfully navigate the market – meaning smaller players are at a disadvantage – but being too large can limit execution of investment ideas – meaning larger managers’ core performance tends to mirror the index.
Our 2023 re-examination stands firm with the 2019 conclusions, Core returns continue to be widely dispersed and manager size can be a differentiating factor for investment returns. In our view a core manager needs to be large enough to have the resources in all available asset classes, but not so large as to miss out on vast segments of the market. Right sized managers can have a significantly larger number of investment opportunities, as well as the ability to be nimble in sector rotation and secondary trading.
Our 2023 analysis found that many large managers embed out-of-index products like emerging markets, high yield and bank loans to generate excess returns in order to compensate for Core returns that mirror the index. These strategies can augment returns, but introduce out-of-index risk with a higher risk profile. Additionally, the 2023 review goes a step further concluding that within Core Fixed Income, performance returns are actively influenced by:
1. Sector Allocations.
2. Security Selection.
3. Access to Secondary Markets.
The bottom-line: Often, large managers (those over $50 billion) generate index-like returns in their Core portfolios and augment those returns with higher-risk strategies such as High Yield, Emerging Markets and bank loans while mid-sized managers (those between $10 billion and $50 billion) often generate excess returns within their Core portfolios through sector allocation, security selection and by having access to secondary markets.
This paper examines these conclusions in more detail while exploring the question: Is your Core Fixed Income Portfolio working hard enough?
Manager Universe and Selection
In this study we evaluated the returns of the eVestment Core Fixed Income Manager Universe; a universe of mandates against various Bloomberg Aggregate Indices. Similar to the review performed in 2019, we filtered managers to create a universe with similar risk profiles. First, we filtered managers to a +/- 15% tolerance to the duration of the Bloomberg Aggregate Index. Second, we excluded managers from the study that embedded >3% weightings in the following Non-Core segments: High Yield, Bank Loans or Emerging Markets. After exclusions, the universe is comprised of 133 portfolios across 102 firms.
Sector Weightings
As stated above, one cause for return dispersion is sector allocation. Exhibit 1 displays Sector Weightings by Firm Assets Under Management (AUM). Sector weightings can vary due to firm expertise and strategies employed. Firms having less than $1 Billion in AUM generally have lower concentrations in structured securities. All designated Firm AUM’s are underweight the Government Sector and overweight the Corporate Sector. Meaningful over weights in sectors, defined as more than 5%, are not common except in the corporate market.
Exhibit 1: Sector Weightings by Assets Under Management
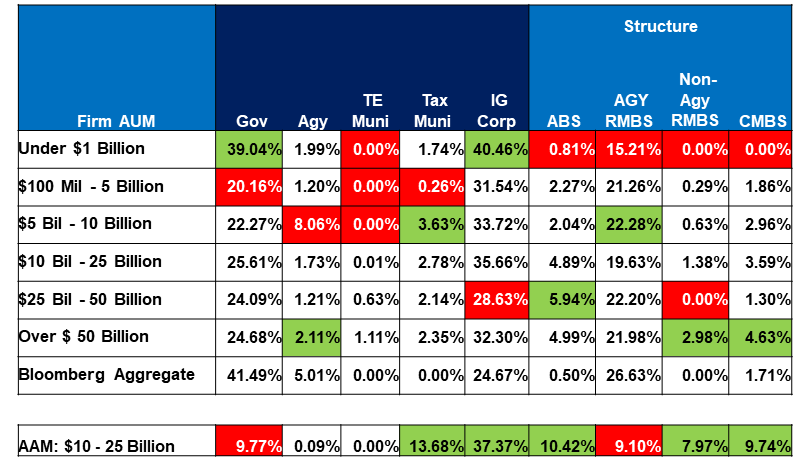
Sources: eVestment US Broad Market Core Fixed Income Separate Accounts and Common Funds Universe. Average Annual Data as of 09/30/2023 (SA + CF). Bloomberg data of 09/30/2023. Core Managers benchmarked to the Bloomberg Aggregate Index. Excludes those with 3% or more in Emerging Markets, High Yield, Private Placements or Bank Loans.
Does manager size impact access to markets? Our analysis suggests an asset manager having $10-$25 billion in AUM has two distinct advantages to produce excess returns: First, they manage an asset base large enough to justify credit/structured product resources and second; they have the ability to accumulate market overweight positions in smaller sectors, issues and issuers. Simply put: A nimble ability to access all markets.
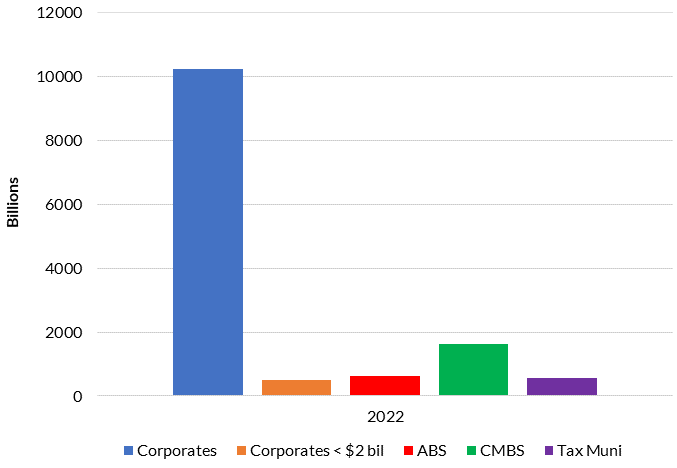
The Investment Grade Fixed Income market is very large in size; $25 Trillion. The Corporate market is also large as demonstrated in Exhibit 2 with $10 trillion in outstanding debt (SIFMA). However; if we focus on four specific excess return generating sectors, smaller Corporate issuers (< $2 billion), Asset-Backed, Commercial Mortgage-backed and Taxable Municipals, the market contracts significantly.
Corporate issuers with less than $2 billion in debt outstanding represent 43% of all issuers but only 0.05% of all issuance; $319 billion dollars. Accordingly, the ability of a large asset manager to accumulate market weights on a pro-rata basis in these securities may be difficult, if not impossible. To continue, in Exhibit 2, when reviewing Debt Outstanding by Fixed Income Sector, we find the Asset-Backed, Commercial Mortgage-backed and Taxable Municipal markets are also diminutive relative to the $10 trillion Dollar US Corporate Investment Grade Fixed Income market. ABS, CMBS and Taxable Municipals have $1,624, $633 and $554 billion outstanding debt, respectively.
Exhibit 2: Debt Outstanding by Fixed Income Sector
Sources: SIFMA, JP Morgan, Bloomberg Analytics, AAM
To illustrate this point further, in Exhibit 3, we review the percentage of issuers an asset manager, based on size, could add to a portfolio to create an overweight position. Due to liquidity, we assume a manager would not accumulate more than 10% of an outstanding issuer’s total debt. The number of issuers a manager can add a meaningful 0.5% position declines significantly with increasing firm size. We applied this same logic across the CMBS, ABS, and Taxable Municipal sectors. Larger managers may face significant challenges in accumulating market weight positions. Smaller managers can have the benefit of significantly more market opportunities.
Exhibit 3: Percent of Selected Market Sectors Managers Can Overweight
(assuming accumulation of a 0.5% position)
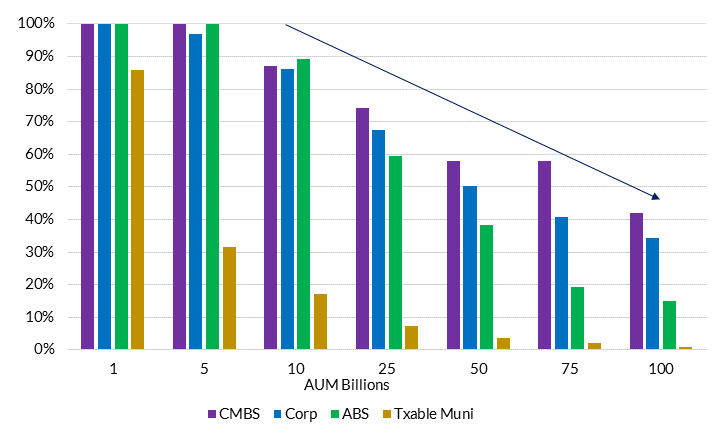
Sources: US Corporate CMBS, ABS and Taxable Municipal Markets courtesy of Bloomberg Analytics, US Issuers as of 12/13/2023. *As of 12/13/2023 Bank of America is the largest US Corporate Issuer representing 0.65% of the Bloomberg US Aggregate Index. Assumes the manager is capped at owning 10% of the issuer’s eligible debt and 0.5% of any individual issue
Security Selection
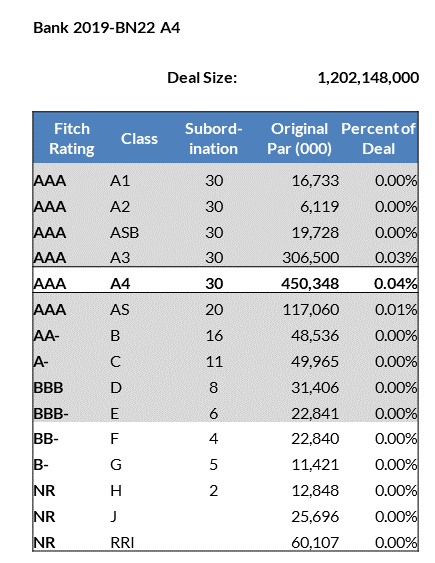
As discussed earlier, 43% of Bloomberg Corporate Index issuers are under $2 billion in size. Similarly, ABS, CMBS and Taxable Municipal issuers under $2 billion in size, represent 53%, 32% and 96% of these sectors respectively. In addition, the CMBS and ABS sectors have yet another nuance which can make it difficult for large managers to accumulate positions: They are “structured”, that is; their cashflows are segmented into small tranches creating subordination (principal protection) to achieve desired ratings and risk. Exhibit 4 displays a typical CMBS deal. Each tranche has a different CUSIP, duration, subordination and quality. In this example, we find the largest tranche is approximately $450MM. Given market demand for these structures, the ability for a large manager to accumulate a benchmark weight in a security and achieve diversification in this sector can be difficult at best and, on a pro-rata basis, even harder.
Exhibit 4: CMBS Security Structure
Secondary Market: Dealer Inventories
In the new issue market, managers with assets over $50 billion in AUM may find it difficult to meet pro-rata allocation needs. As such, to fill out positions, they must access dealer inventories in the secondary market. Next, we review the dollar amount of securities held on dealer balance sheets. As we can see in Exhibit 5, due to new rules instituted by the Congress and SEC after the Great Recession of 2008, corporate debt held on dealer balance sheets has fallen dramatically. Immediately after the crisis, dealers such as Goldman Sachs became banks to access federal loans resulting in Increased surveillance by the Federal Reserve which led to reduced amounts of debt in dealer inventories. Exhibit 5 also shows the ABS, CMBS and Taxable Municipal markets have flatlined as the dollar amount of issues held on dealer balance sheets hasn’t grown since the Great Recession.
Exhibit 5: Dealer Inventory
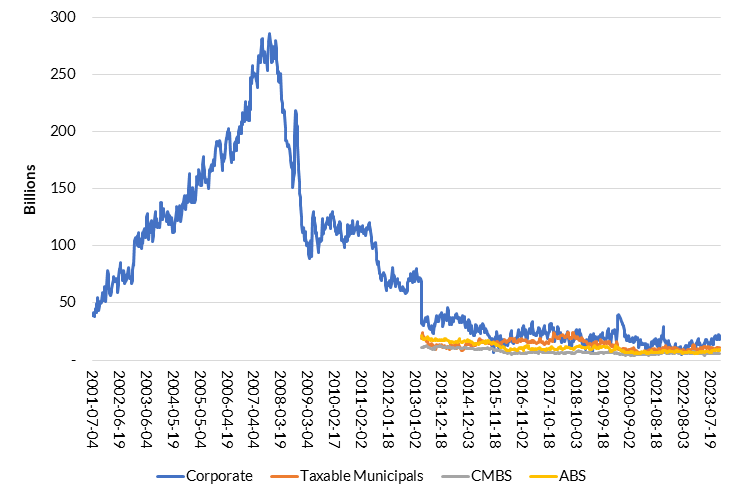
Sources: Federal Reserve Bank of New York, AAM as of 11/21/2023
It follows that limited dealer inventories in the secondary market can make it more difficult for managers >$50 billion in size to fill large allocations to match overweight targets or benchmarks. In Exhibit 6, as we capture the volume of secondary market trades greater than $250K, we can demonstrate the impact of restricted inventories. We further break this down into two categories: the percentage of trades between $250K – $5mm, and trades > $5mm. We find there is a much lower volume of trades > $5 million in size than below. Again, this is the threshold for a larger firm to accumulate benchmark weightings in individual names. Therefore, it seems managers with fewer assets have an advantage accessing and filling allocations in these markets.
Exhibit 6: Transaction Volume – Trades Based on Size
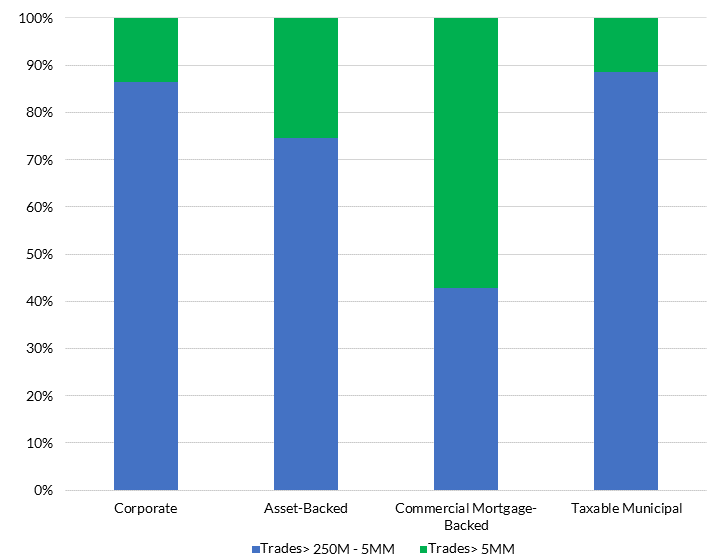
Sources: Bloomberg Trace Data as of 12/08/2023. Fixed Coupon IG, Asset-Backed, Commercial Mortgage-Backed and Taxable Municipal Trades as a percent of all trades > 250,000 par and above
Total Returns Over Time
Finally, we review differences between core manager’s total and excess returns by AUM. As of 09/30/2023, Exhibits 7 and 8 display managers by Assets Under Management and trailing period Total and Excess Returns. Managers with less than $1 billion in assets, have less competitive returns and may not have the portfolio management, trading, research and technical resources to analyze and access all credit and structured markets. A manager having over $50 billion in assets may find it difficult to traffic in smaller sectors, issues and issuers failing to accumulate market weights in securities, leaving total and excess return on the table.
Managers with Total Assets Under Management of $10 to $25 billion have generally outperformed larger and smaller managers. And, empirically, AAM’s Core Strategy has delivered competitive total and excess returns across all time frames.
Exhibit 7: Total Return by Assets under Management

Sources: eVestment US Broad Market Core Fixed Income Separate Accounts and Common Funds Universe. Average Annual Data as of 09/30/2023. US Core Managers benchmarked to the Bloomberg Aggregate Index, Excludes those with 3% or more in Emerging Markets High Yield or Private Placements or Bank Loans.
Exhibit 8: Excess Returns by Assets Under Management
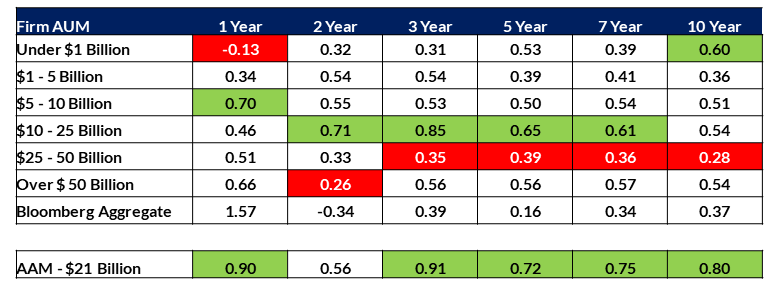
Sources: eVestment US Broad Market Core Fixed Income Separate Accounts and Common Funds Universe. Average Annual Data as of 09/30/2023. US Core Managers benchmarked to the Bloomberg Aggregate Index, Excludes those with 3% or more in Emerging Markets High Yield, Private Placements or Bank Loans. Excess Returns is the measure of the difference between the portfolios actual return versus its expected performance given its level of risk as measured by Beta. It is a measure of the portfolios performance not explained by the movements of the markets.
Conclusions
The conclusions from our 2023 analysis are consistent with our findings in 2019:
Fixed Income Management is not a Commodity
Core returns continue to vary significantly across managers. Excess return is generated by finding attractive relative value across sectors, issues and issuers along the yield curve. The largest part of an insurance company portfolio, the core assets, can be under served and matched to a benchmark missing out on income generating strategies.
The Right Size Manager Provides a Broader Opportunity Set
The more limitations on large managers due to size, the more a manager’s core portfolios may begin to look like the benchmark. It is expensive to pay for passive index management marketed as excess return generating strategies. For a significant portion of the Corporate, CMBS, ABS, and Taxable Municipal markets, managers with greater than $50 billion or more in AUM may have fewer opportunities to build meaningful, overweight positions. The ability for a manager to access all markets is important to generating excess returns. On top of access to more markets, the right size manager can allow for more nimbleness in trading to re-allocate between sectors and issuers.
Manager size, sector weightings, security size and the ability to access the secondary market can all contribute to generating competitive total and excess returns. This begs the question: Is your Core Fixed Income Portfolio working hard enough?
Process and Risk Control
At AAM we employ a yield-oriented approach in a risk-controlled framework. Our experienced research group and traders have the ability to analyze and access all fixed income markets. This allows us to make meaningful allocations to structured and credit markets effectively implementing trades across portfolios. This work, empirically, is captured in the table and graph below: a track record of competitive, value added, total returns.
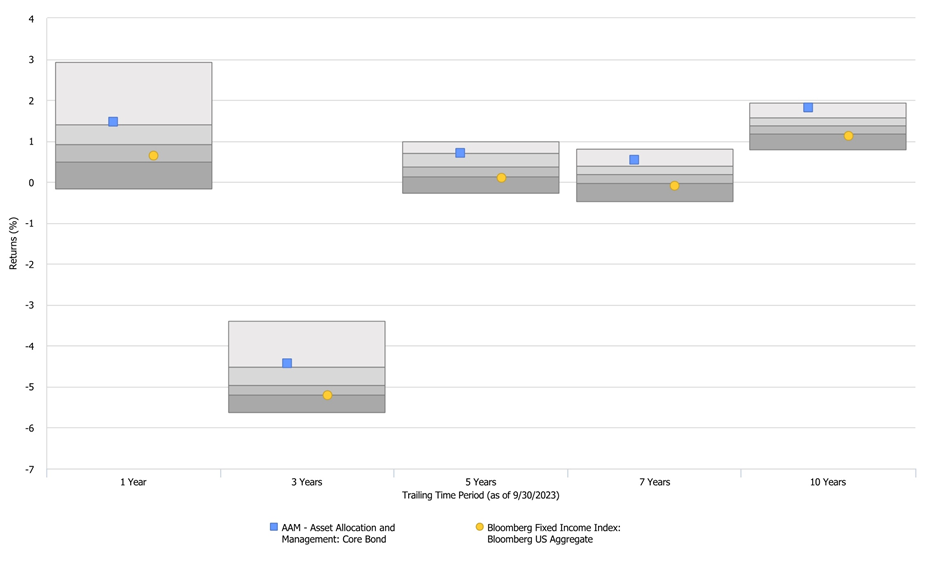
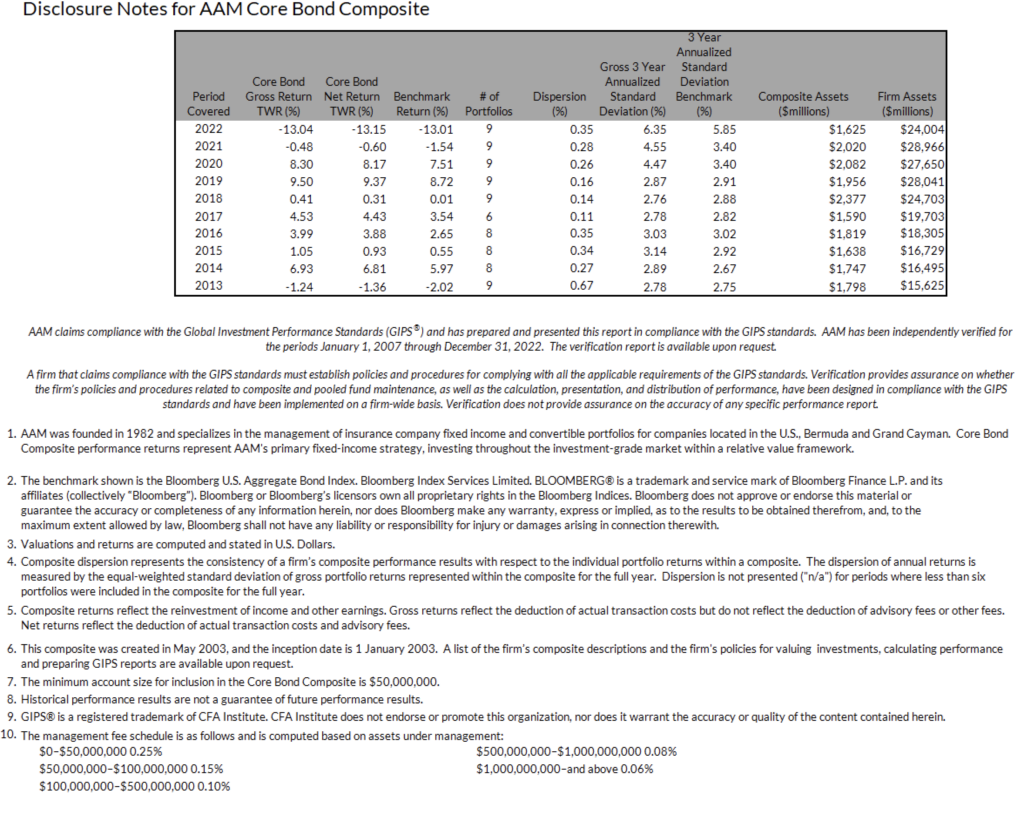
Source: eVestment. All rights reserved. Data as of 9/30/2023. AAM returns are net of fees and reflect the deduction of actual transaction costs and advisory fees. AAM Core Bond Composite includes 9 portfolios and $1,565 million in AUM. Peer group based on eVestment U.S Core Fixed Income Universe which includes 178 firms and 257 products. AAM is not responsible for inaccurate or incomplete data obtained from eVestment. Please see AAM Core Bond disclosure notes. Past performance is not indicative of future results. The Bloomberg Barclays US Aggregate Bond Index is a broad-based benchmark that measure the investment grade, U.S. dollar denominated, fixed rate taxable bond market. The index includes Treasuries, government-related and corporate securities, MBS (agency fixed-rate and hybrid ARM pass-throughs), ABS and CMBS (agency and non-agency). Income from coupons is included in return results. It is not possible to invest directly in an index and index returns do not include any costs or fees. Please see Disclosure Notes for AAM Core Bond Composite.
Disclaimer: Asset Allocation & Management Company, LLC (AAM) is an investment adviser registered with the Securities and Exchange Commission, specializing in fixed-income asset management services for insurance companies. Registration does not imply a certain level of skill or training. This information was developed using publicly available information, internally developed data and outside sources believed to be reliable. While all reasonable care has been taken to ensure that the facts stated and the opinions given are accurate, complete and reasonable, liability is expressly disclaimed by AAM and any affiliates (collectively known as “AAM”), and their representative officers and employees. This report has been prepared for informational purposes only and does not purport to represent a complete analysis of any security, company or industry discussed. Any opinions and/or recommendations expressed are subject to change without notice and should be considered only as part of a diversified portfolio. Any opinions and statements contained herein of financial market trends based on market conditions constitute our judgment. This material may contain projections or other forward-looking statements regarding future events, targets or expectations, and is only current as of the date indicated. There is no assurance that such events or targets will be achieved, and may be significantly different than that discussed here. The information presented, including any statements concerning financial market trends, is based on current market conditions, which will fluctuate and may be superseded by subsequent market events or for other reasons. Although the assumptions underlying the forward-looking statements that may be contained herein are believed to be reasonable they can be affected by inaccurate assumptions or by known or unknown risks and uncertainties. AAM assumes no duty to provide updates to any analysis contained herein. A complete list of investment recommendations made during the past year is available upon request. Past performance is not an indication of future returns. This information is distributed to recipients including AAM, any of which may have acted on the basis of the information, or may have an ownership interest in securities to which the information relates. It may also be distributed to clients of AAM, as well as to other recipients with whom no such client relationship exists. Providing this information does not, in and of itself, constitute a recommendation by AAM, nor does it imply that the purchase or sale of any security is suitable for the recipient. Investing in the bond market is subject to certain risks including market, interest-rate, issuer, credit, inflation, liquidity, valuation, volatility, prepayment and extension. No part of this material may be reproduced in any form, or referred to in any other publication, without express written permission.
