P&C insurers haven’t historically held much exposure to high yield credit, for good reason. When compared head-to-head with equity, high yield also features mark-to-market volatility that directly impacts surplus, but with capped upside and historically lower average annual returns. This has led the P&C industry to sensibly focus its risk asset exposure on equity, whereas high yield allocations (excluding negligible exposures attributable to downgrades of investment-grade holdings rather than intentional allocations) have been uncommon and typically small. But the last two years have seen a noteworthy relative value shift between these assets that the industry has only gradually begun to respond to. In this paper we’ll review the way rising interest rates and spreads have made high yield credit (in both fixed- and floating-rate varieties) more competitive with equity for P&C insurers than it’s been in many years, and examine which sectors of the P&C industry have the lowest exposure and thus the largest potential opportunity.
The table below illustrates comparative returns and drawdowns in US equity, US high yield fixed income, and US high yield floating-rate loans, using the indexes shown as proxies:
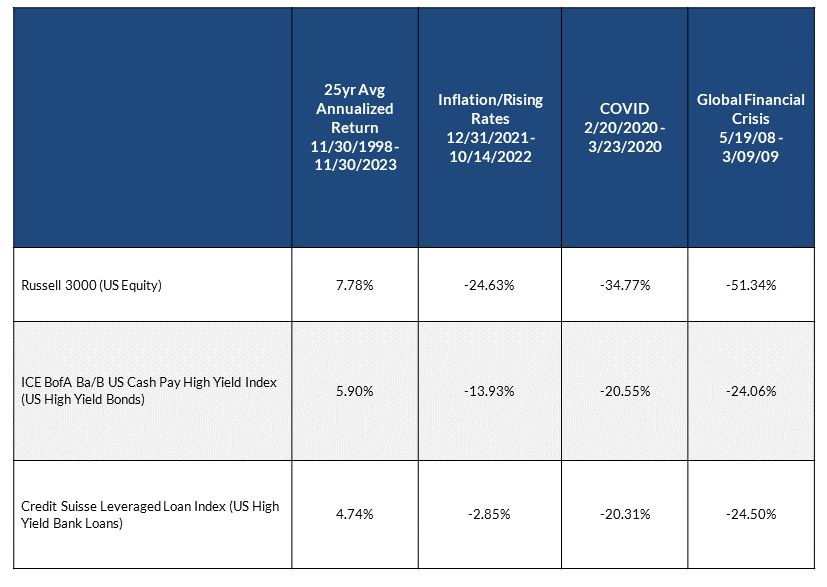
A few themes emerge from these statistics:
- Over time equity has returned more than high yield credit, as one would expect given its lower position in the corporate capital structure
- In stressed market environments equity has typically experienced a larger drawdown than high yield credit, again just as Finance 101 would suggest
- Floating-rate high yield credit has historically returned a little less than fixed-rate high yield while experiencing similar stress case drawdowns, but it also dramatically outperformed in the inflationary/rising rate environment of 2022.
None of these points should be surprising. When we look under the hood of high yield returns, though, some interesting details emerge. For starters, as a fixed-income asset class the majority of its long-term returns are driven by income production, which is relatively predictable based on prevailing yields. In fact, for the ICE BofA Ba/B index cited above, using 25 years of historical returns data we find an 80.5% correlation between yield-to-worst and subsequent 5yr total return. This suggests yield has historically been a reasonable tool for projecting returns, which makes intuitive sense given the nature of this asset.
Given that high correlation between yields and subsequent returns, it’s no wonder P&C insurers have largely avoided high yield; for the 9yr period from 12/31/2012 – 12/31/2021 the average yield to worst on our HY bond index was only 5.37%, not exactly exciting for a mark-to-market asset with potential double-digit downside in a selloff, especially as equity performed extremely well during this same period. But for the 12mo period from 11/30/22 – 11/30/23 the average yield to worst was 7.94%, higher than the average annual return on equity for the last 25 years. While this certainly does not guarantee that high yield will outperform equity over the next 5 years, it does suggest it has the potential to compete to a degree it hasn’t since the GFC. Especially considering that, while high yield must still be marked to market in a selloff, its drawdowns have only been around half as large as those experienced by our equity index in the last few notable market declines. Competitive returns with potentially less downside makes for an intriguing risk/return combo!
While the last couple paragraphs have focused on high yield bonds, a similar pattern holds true for floating rate high yield bank loans. In this case the yield is historically 73% correlated with subsequent 5yr total return, and while low prevailing yields for much of the past decade led to justifiably low interest, the combination of higher recent yields (the yield to maturity on the Credit Suisse Leveraged Loan Index was 9.80% at 11/30) and material protection from rising rates have illustrated its value; our bank loan index actually outperformed both HY bonds and equity for the 18 months ended 11/30/23. While bank loans will likely underperform in a falling rate environment, a “higher for longer” rate scenario could produce strong coupon income for the interim.
We’ve mentioned that P&C insurers don’t hold much HY exposure, but how much is “not much”? We gathered statistics for holdings as of 12/31/22, and grouped them by ownership type. Our composite included a group of 619 P&C insurers with total invested assets from $15M – $5B as of year-end 2022:
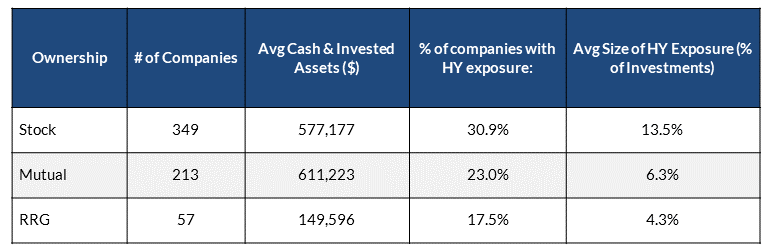
As the table shows, we found that stock companies are both more likely to hold HY exposure (we defined this as having exposure >2% of invested assets to exclude companies that just hold a few fallen angels), and have larger positions among those companies that do have an allocation. Mutuals occupied an intermediate position, with just under a quarter holding HY exposure and only about half the allocation sizes of stock companies. Meanwhile relatively few risk retention groups (RRG’s) had HY exposure, and with an average of just 4.3% exposure among those who did it’s frankly probable that even many of those companies’ holdings are unintentional. We also observed that while RRG’s had smaller investment portfolios on average, they were not more risk-averse; the average unaffiliated equity exposure for RRG’s was 17.8% of investments vs 11.7% for stock companies (mutual had similar levels of equity to RRG’s as well). We were curious if there was evidence that stock companies had been swifter to add to HY as yields rose in 2022, and found that indeed, the number of stock companies with exposure had risen by 7.9% from a year earlier, whereas only 3.5% of RRG’s added HY exposure during the year.
At this writing interest rates have fallen a little from their autumn highs, but the yields available on high yield bonds and loans remain significantly higher than they were for most of the past decade, and remain competitive with long-term returns on equity. That window may close in coming quarters, though. We encourage any P&C insurers who haven’t previously considered these asset classes to revisit the question while time allows, especially those in segments of the industry like risk retention groups that are historically under-allocated to them.
Data sourced from Bloomberg and S&P Capital IQ Pro.
Disclaimer: Asset Allocation & Management Company, LLC (AAM) is an investment adviser registered with the Securities and Exchange Commission, specializing in fixed-income asset management services for insurance companies. Registration does not imply a certain level of skill or training. This information was developed using publicly available information, internally developed data and outside sources believed to be reliable. While all reasonable care has been taken to ensure that the facts stated and the opinions given are accurate, complete and reasonable, liability is expressly disclaimed by AAM and any affiliates (collectively known as “AAM”), and their representative officers and employees. This report has been prepared for informational purposes only and does not purport to represent a complete analysis of any security, company or industry discussed. Any opinions and/or recommendations expressed are subject to change without notice and should be considered only as part of a diversified portfolio. Any opinions and statements contained herein of financial market trends based on market conditions constitute our judgment. This material may contain projections or other forward-looking statements regarding future events, targets or expectations, and is only current as of the date indicated. There is no assurance that such events or targets will be achieved, and may be significantly different than that discussed here. The information presented, including any statements concerning financial market trends, is based on current market conditions, which will fluctuate and may be superseded by subsequent market events or for other reasons. Although the assumptions underlying the forward-looking statements that may be contained herein are believed to be reasonable they can be affected by inaccurate assumptions or by known or unknown risks and uncertainties. AAM assumes no duty to provide updates to any analysis contained herein. A complete list of investment recommendations made during the past year is available upon request. Past performance is not an indication of future returns. This information is distributed to recipients including AAM, any of which may have acted on the basis of the information, or may have an ownership interest in securities to which the information relates. It may also be distributed to clients of AAM, as well as to other recipients with whom no such client relationship exists. Providing this information does not, in and of itself, constitute a recommendation by AAM, nor does it imply that the purchase or sale of any security is suitable for the recipient. Investing in the bond market is subject to certain risks including market, interest-rate, issuer, credit, inflation, liquidity, valuation, volatility, prepayment and extension. No part of this material may be reproduced in any form, or referred to in any other publication, without express written permission.