FIRST QUARTER MUNICIPAL BONDS UPDATE
Tax Cut and Jobs Act 2017 (TCJA)
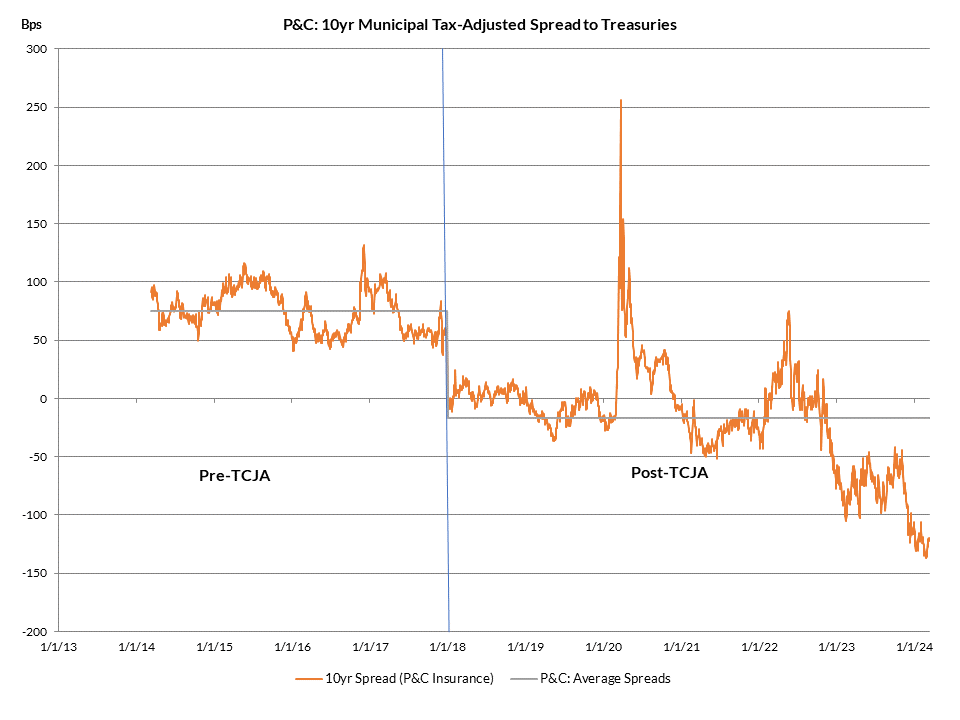
AAM has long been an advocate for reducing exposure to the tax-exempt municipal bond sector in insurance company portfolios since tax-reform was finalized in 2017. The Tax Cut and Jobs Act of 2017 (TCJA) reduced the corporate tax rate from 35% to 21%, effectively reducing the tax-adjusted yields for tax-exempt assets. As highlighted in Exhibit 1, for property and casualty (P&C) investors holding 10yr ‘AAA’ tax-exempts, the average tax-adjusted spread to Treasuries on these holdings went from an average spread of 75 basis points (bps) in the 4yrs prior to the TCJA, to an average spread of -17 bps in the 6yrs following tax-reform1.
Exhibit 1: Tax-Adjusted Spreads for Tax-Exempts Near Historical Low Point
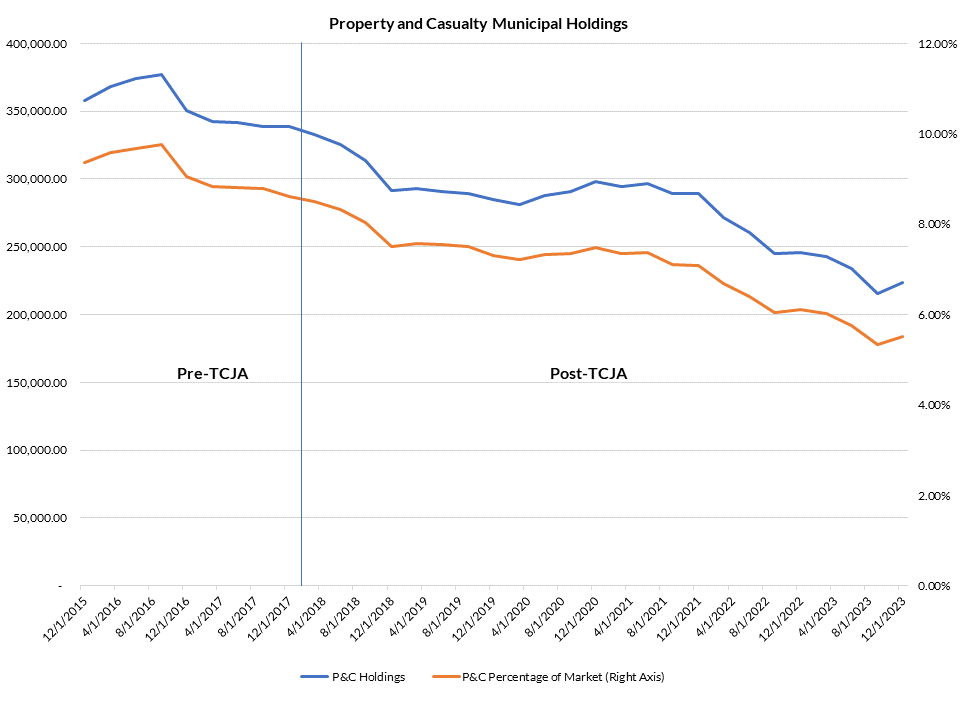
Consequently, insurance companies have already started to migrate out of municipals and into taxable alternatives. In compiling data from the Federal Reserve’s Flow of Funds, the graph under Exhibit 2 highlights this shift in exposure. Since 12/31/2017, on a market value basis, P&C muni holdings have fallen by ~35%, and the percentage exposure to the overall municipal market fell from 8.62% to 5.52% as of 12/31/20232.
Exhibit 2: P&C Insurance Sector Migration Out of Municipal Bonds
However, even with the shifts highlighted in Exhibit 2, we believe there exists further opportunities for P&C investors to take advantage of the reduction in tax-adjusted yield levels. The Flow of Funds data in the graph fails to separate tax-exempt holdings from taxable muni exposure. When incorporating insurance company data from S&P Capital IQ Pro, and reviewing the net investment income sources of P&C insurers, the data confirms that tax-exempt exposure is on the decline. In looking at median data across these insurers, tax-exempt income as a percentage of overall fixed income fell from 18.2% at the end of 2017 to 2.53% as of year-end 2023. However, when looking at aggregate tax-exempt income across these investors at the end of 2023, it still totals a sizeable $5.018 Billion. That’s down 46% from year-end 2017. We believe that current relative valuations of tax-exempts are now at an extremely compelling level that these insurance companies should take another look at sector rotating out of the tax-exempt sector and into taxable alternatives3.
Tax-Exempt Relative Valuations Very Expensive
The tax-exempt market has historically exhibited very strong performance over the first couple of months of the year, driven in large part by seasonally-driven positive technicals. Coming out of this ‘January effect,’ which generally runs from January 1st through the end of February, tax-exempts have performed extremely well, and relative valuations are now very close to the most expensive levels in their history. In looking at more broad-based relative valuation metrics like 10yr municipal-to-Treasury yield ratios, as of 3/12/24, the ratio stood at a very expensive 58.5%. To put that level into perspective, in reviewing data going back as far as 1992, there have only been two other years (2021 and 2023), when ratios have been lower.
Potential Surge in Refinancing Supply Could Pressure Relative Valuations
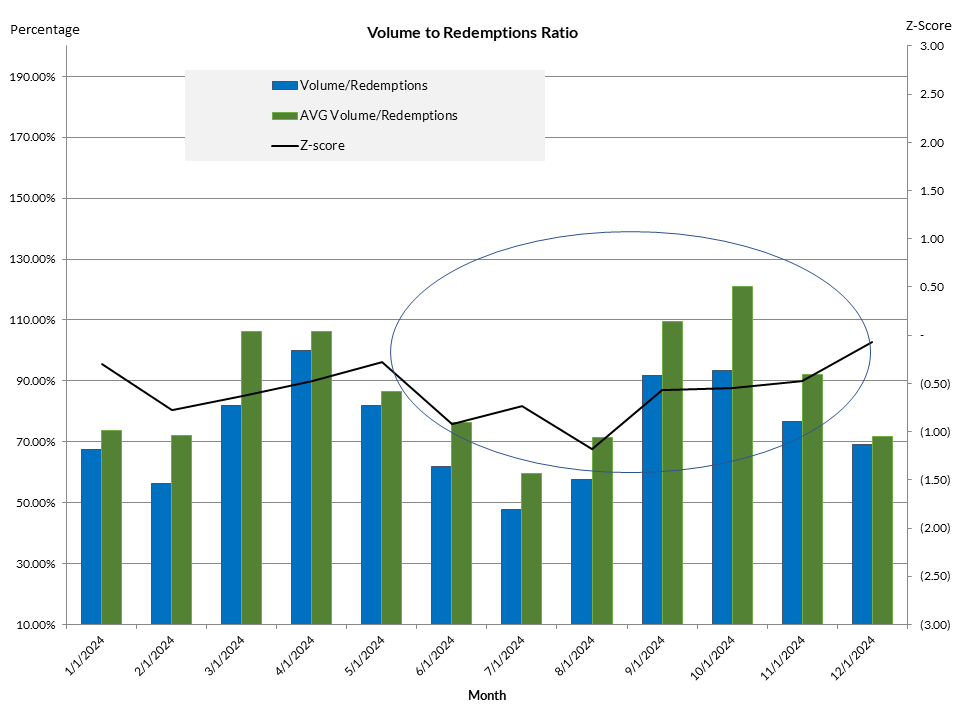
Expected technicals in the market currently support relative valuations, based on projections for new issue supply and redemptions/reinvestment flows for the year. In reviewing Exhibit 3, the graph shows monthly new issuance supply as a percentage of monthly redemptions (i.e., aggregate of coupons/calls/maturities), relative to the trailing 5yr average and accompanying z-scores. After April, the market projected data expects that redemptions will outstrip supply for most of the year, with z-scores mostly falling in a range of -.5 to -1 standard deviations4.
Exhibit 3: Expected Technicals Appear Supportive for Relative Valuations
However, there could be a surge in unexpected issuance that could impact the market in the form of increased call activity. The elevated rate environment of the past two years has seen a dramatic increase in the number of tender offerings. Although there is not a consistent publishing platform for tracking tender offerings, the Bond Buyer reported in 2023 that tender offerings reached a high of $14.1 Billion through July of that year. That compares to only $4 Billion of activity in both 2021 and 2022. For taxable munis that were issued in the low yield environment of 2020 and 2021, the current elevated rate levels have pushed those prices into deep discounts, and issuers are finding extremely compelling interest cost savings in buying back this discounted debt and refinancing it in the tax-exempt market5.
In addition to tender offers, the market could also see an increase in call activity tied to Build America Bonds (BAB). The relatively low nominal yields on tax-exempts, combined with the higher-yield induced reduction of the premium price level on BABs, have made the refinancing of this debt very attractive. In a recent federal court case involving the Indiana Municipal Power Agency, the court ruled that the reduction of the BAB 35% federally-backed coupon subsidy, which was cut by sequestration in the American Taxpayer Relief Act of 2012, was a material adverse event. The market expects that issuers will use this finding to allow for triggering of an extraordinary event to call their BAB debt6. Although it’s unclear if there could be legal challenges ahead that hinder these calls from being exercised, there have been market estimates that the sector could see in excess of $30 Billion of calls related to BABs this year7. In the case of both tenders and BAB calls, for the calls to remain economically viable, the interest cost savings are heavily dependent on both the level of taxable yields remaining high, and that the relative expensiveness of tax-exempts needs to be maintained near their current levels. Consequently, you could see issuers moving aggressively to take advantage of the current market dynamics, with the resulting build in tax-exempt refunding/refinancing issuance potentially pressuring relative valuations to weaker levels.
Compelling Alternatives to Tax-Exempts
In reviewing the comparative tax-adjusted yield curve graph (Exhibit 4), as of 3/12/2024, there are a number of exceptional excess-yield generating alternatives to tax-exempts in the intermediate area of the curve. At the ‘AAA’ level, asset-backed securities (ABS) and taxable munis in 5 yrs offer a yield pickup of 174 and 139bps, respectively, on a tax-adjusted basis. In the 10yr area, ‘AAA’ taxable munis provide 160bps of tax-adjusted excess carry. Additionally, in moving down in credit to the ‘A’ level, 10yr low-beta industrial corporates out-yield tax-exempts by 188bps. In avoiding credit risk altogether, even 10yr Treasuries provide a substantial tax-adjusted yield pickup of 120bps8.
Exhibit 4: Compelling Alternatives to Tax-Exempts
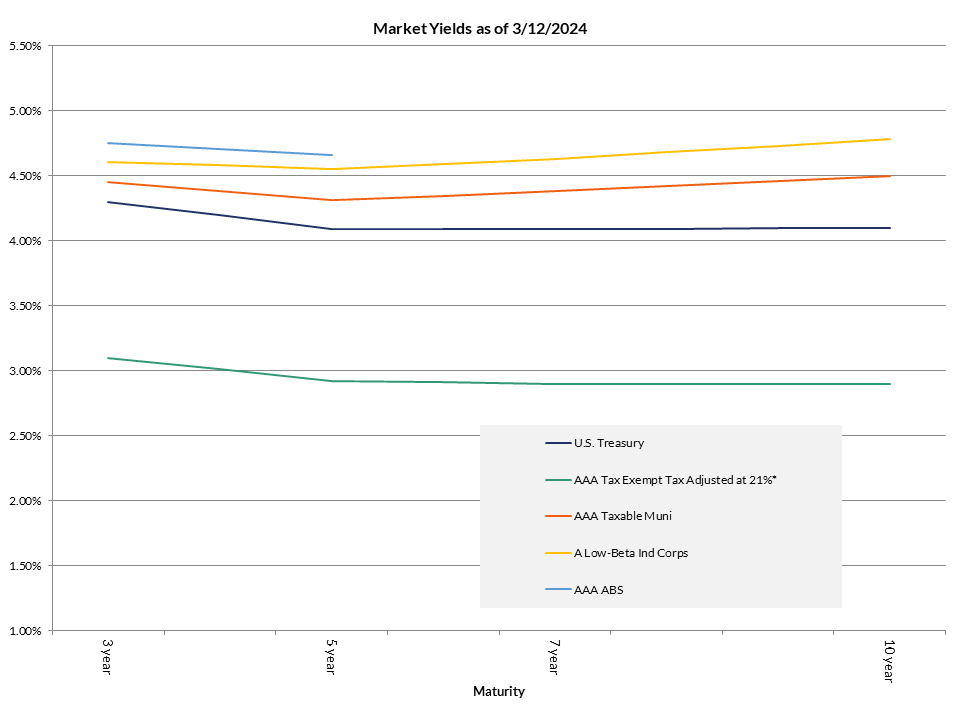
*21% Corp Rate Tax-Adjusted at a Factor of 1.1994
Conclusion: Sector Rotation Trade Timing is Compelling
Insurance companies have made significant strides in reducing tax-exempt exposure, but there clearly are more opportunities for the execution of this trade. With the Federal Reserve’s hawkish monetary policy pushing taxable 10yr yields to over 4%, insurance companies have a great opportunity in improving the book yield profile of their portfolios through the reduction of tax-exempt assets. While taking losses could be an issue in executing the swap of tax-exempts for taxable alternatives, perhaps matching off these sales versus other sectors could be appropriate. One sector that’s particularly attractive for harvesting gains would be equities. The S&P 500 index recorded returns of 26.29% and 7.63% in 2023 and 2024 YTD, respectively9. For those insurers that owned stock and have enjoyed similar performance in their equity positions, selling these holdings at a gain could help in making this sector allocation shift as tax efficient as possible.
As of this writing, 10yr tax-exempts tax-adjusted yields to Treasuries have moved to even more expensive levels since the end of February, with spreads now reaching -137bps. Even when taking losses into account, in our opinion, we believe the trade is compelling and the timing for the sector rotation out of tax-exempt municipal assets is worth pursuing now10.
1 Bloomberg, Refinitiv
2 BEA
3 S&P Capital IQ Pro
4 BofA Securities
5 Bond Buyer, AAM, BEA
6 Raymond James
7 JP Morgan, Barclays
8 AAM, Bloomberg, Refinitiv
9 Bloomberg
10 Bloomberg, Refinitiv