National Lampoon’s holiday sales summary
The holiday season continues to be a critical time of the year for retailers as some can earn up to 40% of their annual revenues during this period. Based on adjusted figures from the U.S. Census Bureau, retail sales (excluding auto and gas) for holiday 2018 were up 2.3%. This was the lowest growth rate since the 2008/2009 recession. In 2008, holiday sales were down 4.1% while 2009 improved to positive 0.1%.
The holiday disappointment in 2018 was caused by the government shutdown and significant stock market weakness related to volatility surrounding trade/tariff headlines. Our prediction of around 4% for 2019 is significantly better. The following report explores some of the key components of our analysis.
The consumer is stronger than the abominable snowman
We believe the most important driver of retail sales directly ties to consumer confidence. The table in Exhibit 1 summarizes our analysis of nine factors that contribute to that level of confidence measured year over year.
Exhibit 1

In 2018 statistics were good, and this year’s look slightly better. Based on the year-over-year analysis, it appears that several of these factors are close to peak levels. Even though we have not seen substantial improvement versus last year, we still consider the numbers to reflect a very healthy consumer. This part of the analysis should help support a strong holiday spending season.
Professor Hinkle is back in school – but is he on the nice list?
A review of data from the last twenty years (see Exhibit 2) reveals a significant correlation (77%) between “Back to School” retail sales (as measured in August and September) and holiday sales (as measured in November and December.) To model the trend, we use the U.S. Census Bureau’s adjusted monthly retail trade data which includes a variety of retail businesses (excluding motor vehicle and parts dealers and gasoline stations; sales in those segments have been more heavily impacted by factors outside the control of consumers).
Exhibit 2
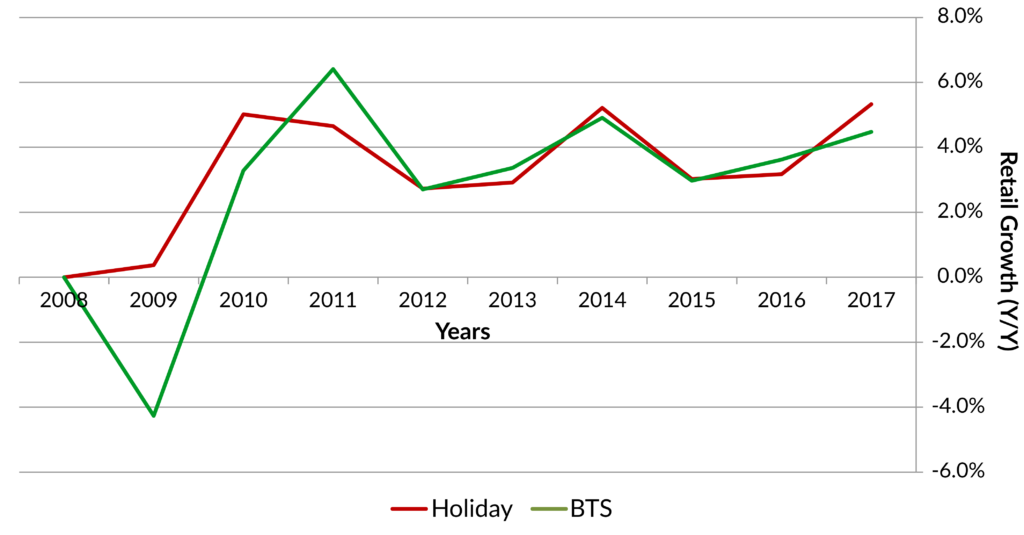
Our regression model predicts adjusted holiday sales of 4.3% when using the 4.6% actual for “Back to School” sales in 2019. This is above the 20 year average of 3.7%. Comparatively, 2018 “Back to School” sales of 4.1% led to actual holiday sales of 2.3%. Clearly the model did not accurately predict holiday sales last year. However, it should be noted that most of the weakness last year came in December when the markets experienced heightened volatility related to the talk of trade wars, the government shutdown, and a severe equity market selloff.
Santa needs more elves for his workshop
Overall, holiday related hiring is projected to be mixed this year. In many cases a lower rate of hiring in brick and mortar is offset by a greater need for employees to support e-commerce sales. It’s difficult to draw major conclusions from these numbers given the struggle to hire part time workers due to current low unemployment and efforts to pay existing employees a higher wage. Some retailers, including Walmart, will give current employees the opportunity to work holidays instead of hiring seasonal workers.
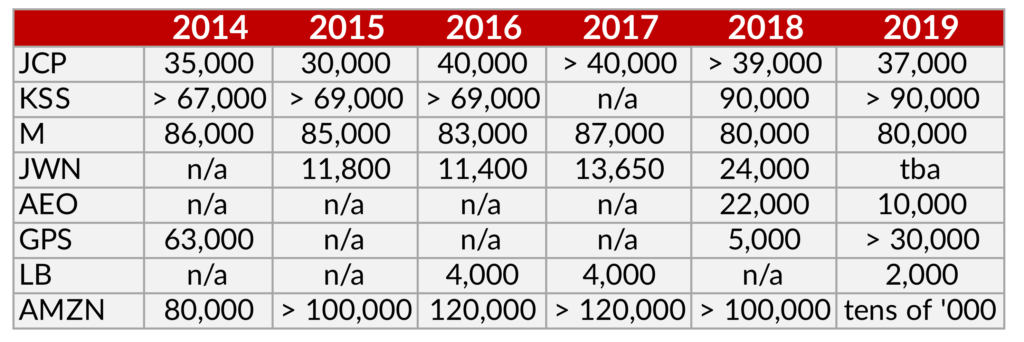
According to the National Retail Federation (NRF), temporary hiring will range between 530,000-590,000 which is comparable to last year’s 554,000. As shown in Exhibit 3, Kohl’s is the only retailer who plans to add more seasonal jobs this holiday season.
Exhibit 3
Deck the halls with tariffs for all
The second wave of tariffs is expected to begin on December 15th. This is in addition to new tariffs that began on September 1st , which included traditional holiday items such as TVs and apparel. We would expect the direct impact on consumer spending to be limited as we believe price increases during the holiday will be very limited. Nonetheless, 79% of consumers surveyed for NRF in September were concerned that tariffs will cause prices to rise, potentially affecting their approach to shopping. Shoppers expect a good deal and know when and where to make the best value purchase. For the most part, this is expected to be a “company” problem not a “consumer” problem. That could change in 2020 if tariffs remain in place and/or become more onerous.
There could be a secondary impact on spending from ongoing trade talks and tariffs. Large retailers have been diversifying their supply chains. It’s possible we will see disruption on that front which could cause less product to make it to the shelves, diminishing demand. In addition, negative headlines related to trade could create market volatility, leading to uncertainty and lower holiday spending.
Kris Kringle or Cyber Santa?
Online sales continue to grow at a double digit rate, which help retailers maintain overall business as foot traffic to brick and mortar locations continues to decline. Another positive is that weather has become less of a factor for retail results as online sales become easier and more popular across demographics. According to the U.S. Census Bureau, e-commerce now accounts for 12.5% of total retail sales year-to-date. We believe that figure is above 20% if one excludes segments that are not currently at significant risk of an internet presence such as auto sales, restaurant/bar sales, and gas station sales. Through October growth for the online category was 12.7%. That’s almost four times the 3.2% growth of total retail sales year-to-date.
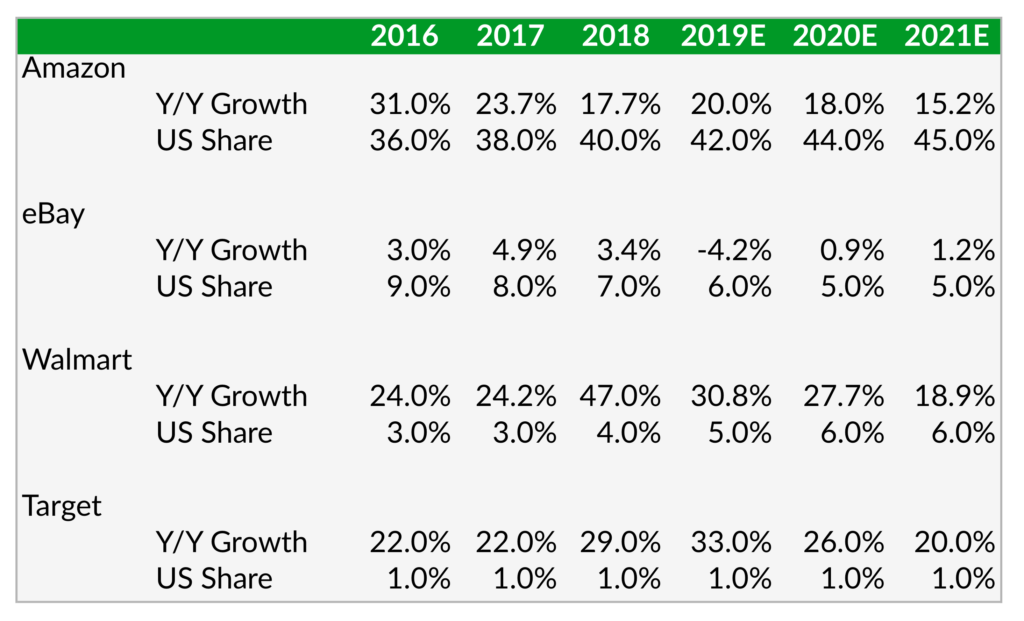
Exhibit 4 illustrates the power of just one of the many trends developing in e-commerce. The graph below shows the opportunity to grow online sales in the discounted space led by Walmart and Target. Both of these companies have tremendous resources and initiative to compete in the space. Their growth is ramping up at the expense of Amazon and eBay. The ability to shop online and pick up your item at your local Target or Walmart has become extremely popular. With several thousand stores spread across the U.S. these retailers have a significant advantage.
Exhibit 4
Several sources have reported successful Thanksgiving and Black Friday shopping results. According to Adobe Analytics, online sales (desktop & mobile) of $11.6 billion were up 17% over last year. That compares to 25% growth for 2018. Sales completed on smartphones continue to be the largest driver of e-commerce with smartphone sales accounting for 41% of online sales versus 31% last year. According to ShopperTrak, visits to stores over the two day period fell 3% with a 6% drop on Black Friday. Black Friday results were slightly weaker given heavy promotion in the beginning of Thanksgiving week and an earlier start to holiday shopping given lower than usual available shopping days until Christmas.
Dasher, Dancer, and Prancer agree that Santa will be busy
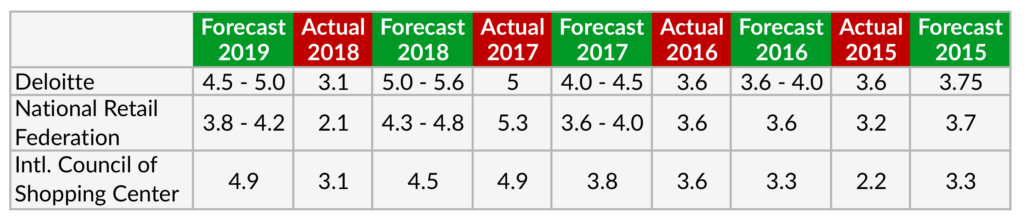
We have included a summary of three trade groups that publish their views on upcoming holiday sales. While each of them use a different data set to support their expectations, it is still important to note the growth year-over-year. In addition, we thought it would be interesting to look at how accurate each group has been over the past four years. Based on this data, we would not favor any one of these trade group’s prediction over the other. Also, it’s clear they all were too optimistic last year as was the majority of the Wall Street analyst community.
Exhibit 5
According to a survey released by the National Retail Federation (NRF), shoppers will spend an average of $1,048 in 2019 for a total of approximately $728 billion. Shoppers plan to spend most of their time online and in department stores. For the 13th year in a row, the most popular present is expected to be gift cards. The most important factor when shopping at a particular retailer remains sales and discounts.
Walking in a not-so-wintery wonderland
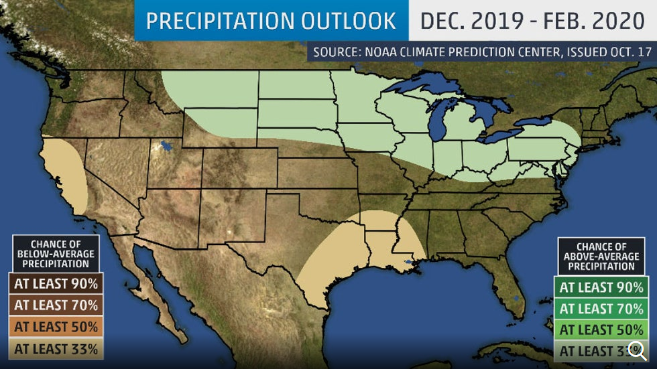
Weather and the shifting calendar are always important factors for holiday spending. According to Weather Trends International (WTI), December is expected to be slightly cooler with temps averaging 37.4F. Average precipitation for December is expected to be down 26%. The ideal weather for traveling holiday shoppers is cold and dry. Retailers want shoppers to buy winter products but not be turned away by heavy snow.
Exhibit 6
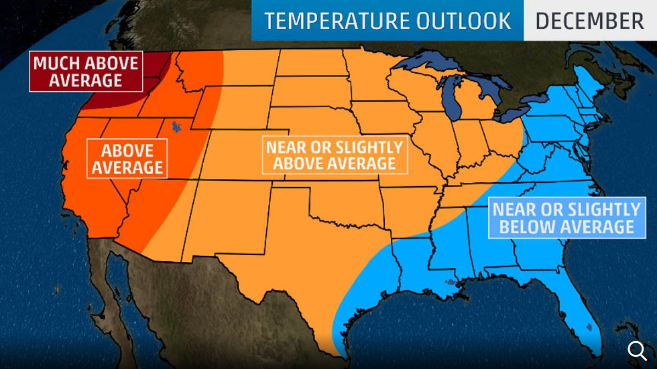
Exhibit 7
A key statistic tied to the strength of holiday retail sales is the number of days between Thanksgiving and Christmas. The maximum number of days possible is 32 and the minimum is 26. Obviously, for retailers the more shopping days between Thanksgiving and Christmas the better. This year, the total shopping days is 26, the minimum, versus the maximum 32 from last year. In addition, there are eight total weekend days to shop which is the minimum, versus the 10 weekend days we had last year.
Tie it up with a bow
We are optimistic about 2019 holiday spending. Consumer confidence is high and consumers are ready to spend this holiday season. The key predictor of back-to-school sales was better than last year, and the retail sector continues to expand with the ease and efficiency of online shopping. While tariffs and trade talk continues to create volatility in the financial markets, consumers seem to dismiss the potential downside. Of course, this is easier to do with the stock market up 246% year-to-date and with limited price increases expected during the holiday season.
Disclaimer: Asset Allocation & Management Company, LLC (AAM) is an investment adviser registered with the Securities and Exchange Commission, specializing in fixed-income asset management services for insurance companies. Registration does not imply a certain level of skill or training. This information was developed using publicly available information, internally developed data and outside sources believed to be reliable. While all reasonable care has been taken to ensure that the facts stated and the opinions given are accurate, complete and reasonable, liability is expressly disclaimed by AAM and any affiliates (collectively known as “AAM”), and their representative officers and employees. This report has been prepared for informational purposes only and does not purport to represent a complete analysis of any security, company or industry discussed. Any opinions and/or recommendations expressed are subject to change without notice and should be considered only as part of a diversified portfolio. Any opinions and statements contained herein of financial market trends based on market conditions constitute our judgment. This material may contain projections or other forward-looking statements regarding future events, targets or expectations, and is only current as of the date indicated. There is no assurance that such events or targets will be achieved, and may be significantly different than that discussed here. The information presented, including any statements concerning financial market trends, is based on current market conditions, which will fluctuate and may be superseded by subsequent market events or for other reasons. Although the assumptions underlying the forward-looking statements that may be contained herein are believed to be reasonable they can be affected by inaccurate assumptions or by known or unknown risks and uncertainties. AAM assumes no duty to provide updates to any analysis contained herein. A complete list of investment recommendations made during the past year is available upon request. Past performance is not an indication of future returns. This information is distributed to recipients including AAM, any of which may have acted on the basis of the information, or may have an ownership interest in securities to which the information relates. It may also be distributed to clients of AAM, as well as to other recipients with whom no such client relationship exists. Providing this information does not, in and of itself, constitute a recommendation by AAM, nor does it imply that the purchase or sale of any security is suitable for the recipient. Investing in the bond market is subject to certain risks including market, interest-rate, issuer, credit, inflation, liquidity, valuation, volatility, prepayment and extension. No part of this material may be reproduced in any form, or referred to in any other publication, without express written permission.