insight
Plans for Significant Domestic Liquefied Natural Gas (LNG) Exports Likely to Chill Out
July 17, 2012
In the past decade, the domestic natural gas market has gone from a potential shortage to having nearly a centuries’ worth of supply due to innovation and technological progress. Vast, economic supplies of natural gas have been located in Pennsylvania, Arkansas and Colorado, which has put downward pressure on prices. Many producers of natural gas are supportive of exports of natural gas due to the substantial excess supplies and comparatively low costs. However, we believe there are several impediments to exporting super-chilled natural gas, which may curtail the domestic build out of export facilities in the intermediate term.
It was not quite a decade ago when there were more than 25 liquefied natural gas (LNG) import facilities proposed to address a natural gas shortfall in the United States. Recall that in 2003, the domestic natural gas price (Henry Hub) reached more than $9.00 per million British thermal unit (MMBtu), demand from electric utility consumers was quickly increasing, and supply from conventional resources was dwindling.
Fast forward to 2012. The planning, development and eventual commencement of LNG exports are the clearest signs of how significantly shale natural gas has altered the United States energy landscape. Currently there is one approved LNG export facility under construction, but there are more than a dozen waiting Federal Trade Agreement, Department of Energy and/or FERC approval.
We will briefly provide a background on LNG and discuss the fundamental changes that led to this potential revolution in flows of energy supplies. We will also provide estimates on how the changes could affect supply and consumption domestically as well as internationally and the likely influence on domestic prices
The ABC’s of Liquefied Natural Gas
LNG is natural gas that has been super cooled to a liquid at -260°F (-162.2°C). Liquefying natural gas reduces its volume by more than 600 times, making it more practical to store and transport. In exporting locations, natural gas will be piped to a central liquefaction and purification facility, more commonly known as a “train.” It will then be shipped by an LNG tanker to an importing country. At the import facility, the LNG can either be stored in an above ground super chilled LNG storage tank or heated into its gaseous state and piped for distribution.
Similar to the crude oil market, the natural gas market has regions where there are substantial excess supplies (Qatar, Russia) and regions where demand exceeds supply (Japan/South Korea). As a result, there has been a flourishing LNG market for decades. In fact, the first ship transport of LNG began in 1954, on an experimental basis, with shipments from Louisiana to the United Kingdom. Larger-scale trade of LNG commenced in 1964, when British Gas began importing LNG by ship from Algeria.
LNG contracts typically are indexed to oil prices and are generally valued at 11% – 15% of the importer’s regional crude oil (e.g., Japanese Crude Cocktail, Mediterranean Strip). According to the Oxford Institute for Energy Studies, indexing LNG to higher priced oil is due to the fact that natural gas is a substitute for certain oil products and because of the substantial infrastructure/transportation costs. Much of the LNG traded across borders in the Asia-Pacific and European region is sold under long-term contracts, often times up to 20 years.
Recent Changes Allow the U.S. to Export Liquefied Natural Gas
Innovation, technology and reduced costs to exploit shale natural gas have resulted in significantly more supply than the United States currently consumes. Shale gas refers to natural gas that is trapped within shale formations. Shales are fine-grained sedimentary rocks that can be rich sources of petroleum and natural gas. Over the past decade, the combination of horizontal drilling (rather than conventional vertical drilling) and hydraulic fracturing (fracturing of rock by pumping water into a well at very high pressures) has allowed access to large volumes of shale gas that were previously uneconomical to produce. This is evident in the annual production figures as demonstrated in Exhibit 1.
Exhibit 1: Daily Domestic Natural Gas Production
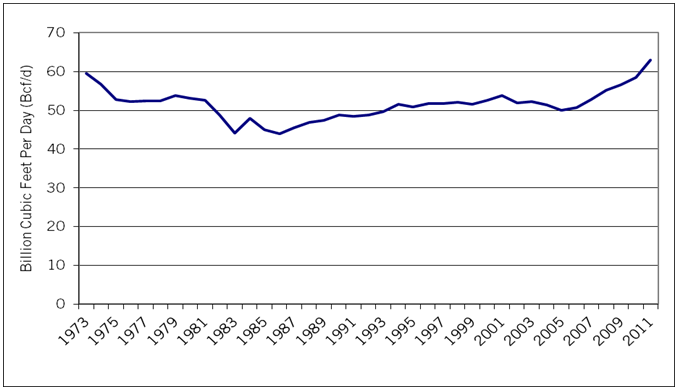
Source: AAM, Energy Information Association, Dept. of Energy
Even more compelling is the reserve data from the government. Recall that reserves are equivalent to inventory. Proved natural gas reserves have increased by 66% from their lowest point in 1998 as Exhibit 2 depicts. Moreover, the U.S. Energy Information Administration’s Annual Energy Outlook 2012 estimates that the United States possessed 2,214 trillion cubic feet (Tcf) of technically recoverable natural gas resources (these resources have not been proved via drilling, but seismic data strongly suggests the natural gas is there) as of January 1, 2010. At the 2011 rate of U.S. consumption (about 24.4 trillion cubic feet per year), this amount of reserves is enough to supply over 90 years of use.
Exhibit 2: Domestic Natural Gas Reserves
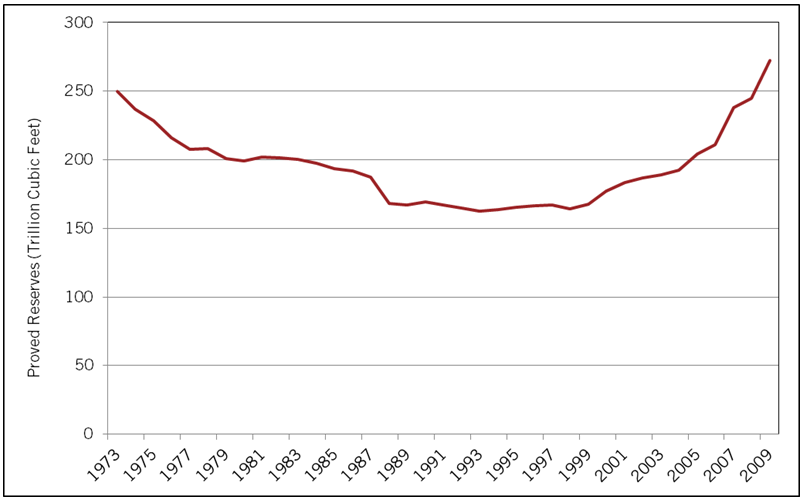
Source: AAM, Energy Information Association
Perhaps as important as the sheer size of the reserves and production of shale natural gas is the fact that the costs associated with exploiting those assets are much lower than conventional natural gas production. In fact, domestic shale gas is competitive from a cost basis to nearly any natural gas produced in the world. Exhibit 3 shows the estimated variable costs to produce natural gas from different regions in North America. Noticeably, the shale plays (gold bars) are the lowest cost regions, while the older/conventional regions (blue bars) are the highest cost.
Exhibit 3: Domestic Natural Gas Supply Cost Curve
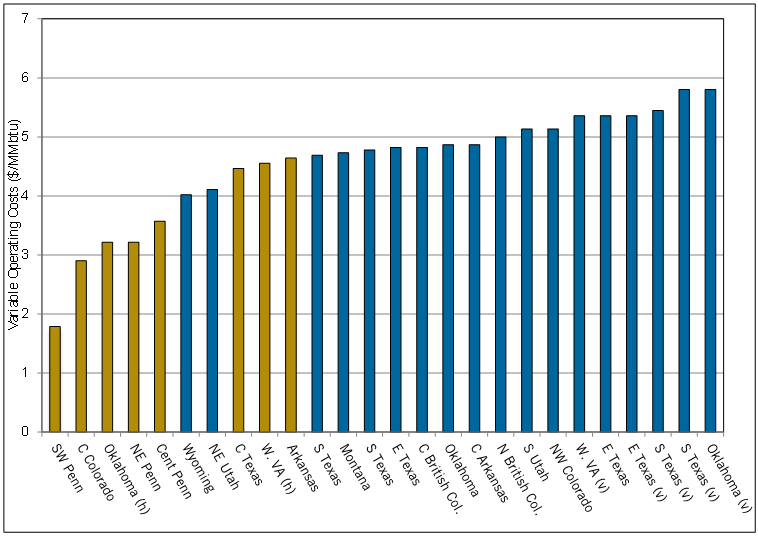
Source: Goldman Sachs, AAM.
(h) = horizontal drilling (AKA “ unconventional”)
(v) = vertical drilling (AKA “ conventional”)
Gold bars are shale plays; blue bars are conventional/other.
Furthermore, LNG from the U.S. could be cost competitive with LNG from other regions. While recognizing that domestic prices are under negative pressure due to the historically warm winter of 2011-12, domestic prices are clearly lower than the realized prices in Europe and Japan, where prices are currently $16.82/mmbtu and $12.22/mmbtu, respectively.
Exhibit 4: Potential Savings From U.S. Liquefied Natural Gas
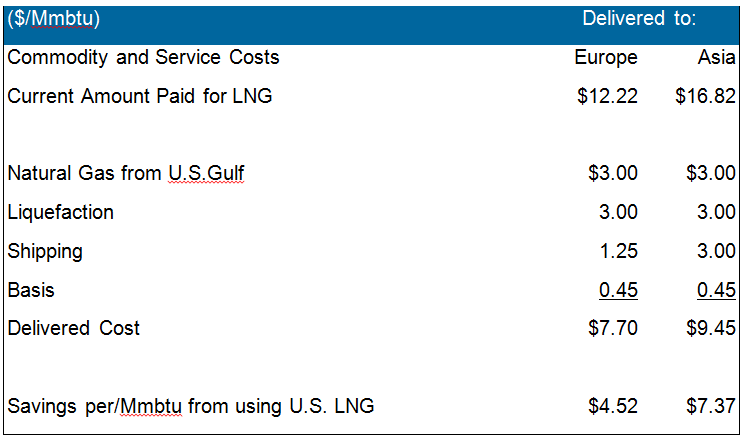
Source: Cheniere Energy, AAM
The Export Market for Domestic Liquefied Natural Gas
Obviously supply from the U.S. is plentiful and relatively inexpensive, but is there a market for U.S. LNG currently? Eventually, there could be, but we believe U.S. LNG exports will not be meaningful until 2016 at the earliest as changes to the LNG industry take a significant amount of time due to the substantial capital investments required and the length of contracts between LNG exporters and importers. The LNG industry has historically been based on long term sales and purchase agreements, frequently lasting 20 years or more. These purchase agreements have been necessary to provide security of cash flow for the exporters to justify the high investments necessary in the LNG train, including the natural gas production ($3.5 billion for 1 bcf/d for 10 years), liquefaction ($5.5 billion for a 1 bcf/d plant) and multiple ships ($200MM each). This means that U.S. LNG exports probably will not materialize until there is incremental demand and/or an existing contract expires, which is replaced by lower cost domestic LNG exports. In addition to these challenges, by 2016 the LNG market could have substantial excess capacity as several large projects from Australia (Gorgon, Gladstone, Curtis) all come online.
Partially mitigating the supply concern is China, which is expected to increase LNG consumption by 0.5-1.0 bcf/d as it increasingly uses natural gas to generate electricity. Additionally, subsequent to the Fukushima disaster in Japan, policy makers there are attempting to reduce their reliance on nuclear power to generate electricity, which means greater dependence on hydrocarbons like imported natural gas. Nevertheless, Exhibit 5 illustrates that the excess capacity margin will likely be 50% greater in 2015 than it is today, which certainly clouds the U.S. LNG export picture.
Exhibit 5: Estimated Supply/Demand
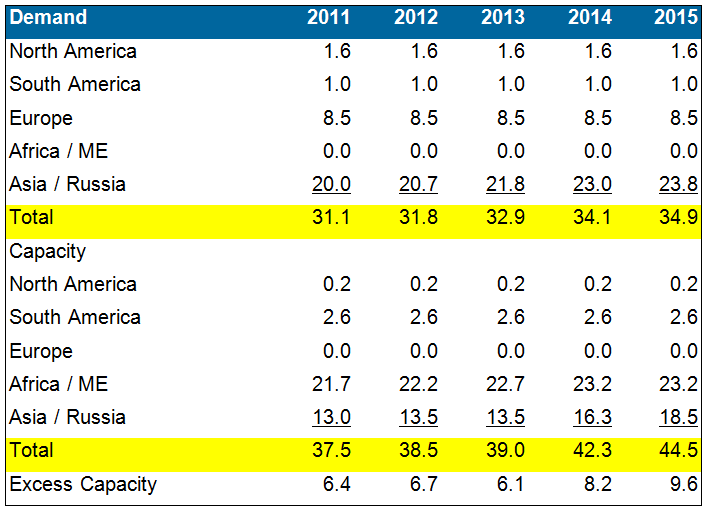
Source: Cheniere Energy, AAM
Exploiting a Competitive Advantage Will Be Difficult
Despite the fundamental challenges which currently exist in the LNG market, we believe there will be several LNG export facilities built in the U.S. The cost savings outlined in Exhibit 4 will be too compelling to pass up for an importer in Japan or China. Listed in Exhibit 6 are the names and details provided to the Department of Energy seeking Free Trade Agreement approval for an LNG export facility. In aggregate, if all the facilities were to get built, they would provide an incremental 17.3 bcf/d of excess capacity on top of the existing 9.6 bcf/d margin by 2015 we noted in Exhibit 5. This substantial and highly expensive excess capacity makes us skeptical that more than half of the proposed domestic LNG facilities get built.
Exhibit 6
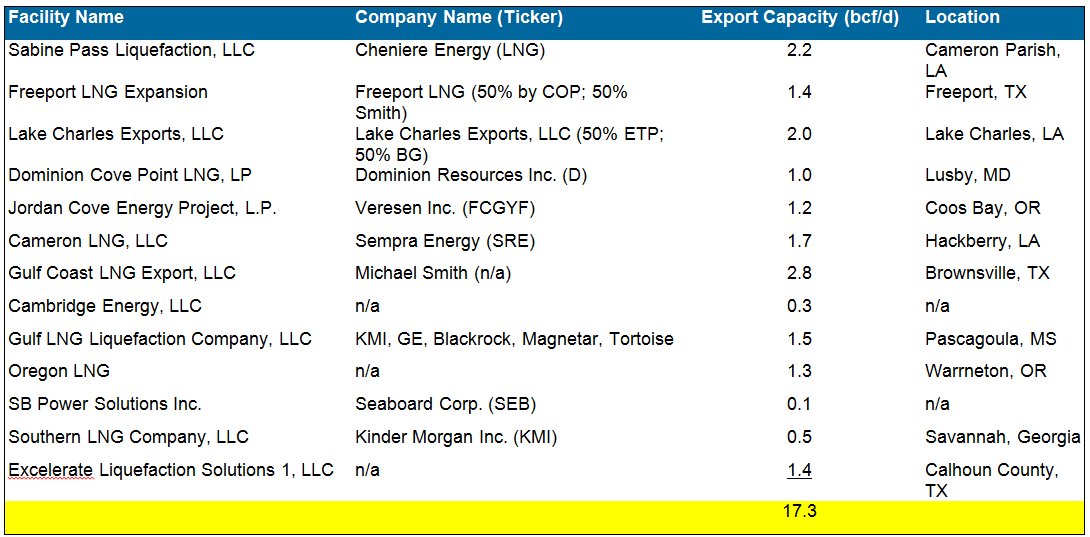
Source: U.S. Department of Energy, AAM
Two other obstacles stand in the way of LNG export facilities. First, the “not in my backyard” or “NIMBY” mentality is very much an issue for the facilities listed in Exhibit 6 and any future proposals. As we stated earlier, there were more than 25 LNG import facilities proposed only a decade ago from coastal cities across the U.S. In reviewing the nine facilities that actually were built, it is evident that the Gulf Coast was the least resistant to the NIMBY argument. Given this relevant and recent history, we think the odds of a non-Gulf Coast LNG export facility getting built are low unless an LNG import facility already exists nearby (Cove Point, Southern LNG).
Secondly, there will be political pressure against natural gas exports, as evidenced by the recent letter from Senator Wyden and Representative Markey to President Obama. The congressmen stated that increasing LNG exports would cause natural gas prices to increase and “severely harm the recovery of key industrial sectors that are so vital to the country’s overall economic well-being,” He mentioned utilities, manufacturing, chemicals, fertilizer and metal industries as industries that would be negatively affected.
Currently, the U.S. consumes approximately 66 bcf/d of natural gas each year. If we assume that in the next five years one-third of the LNG proposals get built, that would result in about 5 bcf/d-6 bcf /d of incremental demand for U.S. natural gas, a 7%-9% increase from current levels. This would undoubtedly put upward pressure on domestic natural gas prices. However, we disagree that LNG exports of this amount would result in natural gas prices rising to a level that would “severely harm the recovery of key industrial sectors.”
Given these obstacles we believe that the few facilities that actually get built will be those that are near a low cost natural gas producing region (Pennsylvania and Texas), have the infrastructure in place to transport the gas from the region to the liquefaction facility (Southeast TX/Southwest LA), have very well financed investors and/or have an existing footprint. Unfortunately, we do not believe those companies which eventually participate in domestic LNG exports will benefit from their contribution for several years (cash flow which will not materialize until the plant is operational and generating cash flow five years from now at the earliest).
The concept of U.S. LNG exports was not even on the radar screen as recently as three years ago. However, the combination of vast resources, innovative uses of old processes and advances in technology has provided the U.S. with so much economical natural gas that many producers would like to export their domestic production internationally where natural gas is priced significantly higher. While it might make economic sense to export natural gas in the near to intermediate term, there are other issues (e.g., permitting, foreign first mover advantage, domestic politics, etc.) that likely will temper the progress prior to 2015. However, we believe that eventually the cost advantage of U.S. natural gas will lead to strong international demand for U.S. LNG resulting in several export facilities getting built.
Written by: Patrick McGeever, Senior Analyst, Corporate Credit
Disclaimer: Asset Allocation & Management Company, LLC (AAM) is an investment adviser registered with the Securities and Exchange Commission, specializing in fixed-income asset management services for insurance companies. Registration does not imply a certain level of skill or training. This information was developed using publicly available information, internally developed data and outside sources believed to be reliable. While all reasonable care has been taken to ensure that the facts stated and the opinions given are accurate, complete and reasonable, liability is expressly disclaimed by AAM and any affiliates (collectively known as “AAM”), and their representative officers and employees. This report has been prepared for informational purposes only and does not purport to represent a complete analysis of any security, company or industry discussed. Any opinions and/or recommendations expressed are subject to change without notice and should be considered only as part of a diversified portfolio. A complete list of investment recommendations made during the past year is available upon request. Past performance is not an indication of future returns. This information is distributed to recipients including AAM, any of which may have acted on the basis of the information, or may have an ownership interest in securities to which the information relates. It may also be distributed to clients of AAM, as well as to other recipients with whom no such client relationship exists. Providing this information does not, in and of itself, constitute a recommendation by AAM, nor does it imply that the purchase or sale of any security is suitable for the recipient. Investing in the bond market is subject to certain risks including market, interest-rate, issuer, credit, inflation, liquidity, valuation, volatility, prepayment and extension. No part of this material may be reproduced in any form, or referred to in any other publication, without express written permission.
Disclaimer: Asset Allocation & Management Company, LLC (AAM) is an investment adviser registered with the Securities and Exchange Commission, specializing in fixed-income asset management services for insurance companies. Registration does not imply a certain level of skill or training. This information was developed using publicly available information, internally developed data and outside sources believed to be reliable. While all reasonable care has been taken to ensure that the facts stated and the opinions given are accurate, complete and reasonable, liability is expressly disclaimed by AAM and any affiliates (collectively known as “AAM”), and their representative officers and employees. This report has been prepared for informational purposes only and does not purport to represent a complete analysis of any security, company or industry discussed. Any opinions and/or recommendations expressed are subject to change without notice and should be considered only as part of a diversified portfolio. Any opinions and statements contained herein of financial market trends based on market conditions constitute our judgment. This material may contain projections or other forward-looking statements regarding future events, targets or expectations, and is only current as of the date indicated. There is no assurance that such events or targets will be achieved, and may be significantly different than that discussed here. The information presented, including any statements concerning financial market trends, is based on current market conditions, which will fluctuate and may be superseded by subsequent market events or for other reasons. Although the assumptions underlying the forward-looking statements that may be contained herein are believed to be reasonable they can be affected by inaccurate assumptions or by known or unknown risks and uncertainties. AAM assumes no duty to provide updates to any analysis contained herein. A complete list of investment recommendations made during the past year is available upon request. Past performance is not an indication of future returns. This information is distributed to recipients including AAM, any of which may have acted on the basis of the information, or may have an ownership interest in securities to which the information relates. It may also be distributed to clients of AAM, as well as to other recipients with whom no such client relationship exists. Providing this information does not, in and of itself, constitute a recommendation by AAM, nor does it imply that the purchase or sale of any security is suitable for the recipient. Investing in the bond market is subject to certain risks including market, interest-rate, issuer, credit, inflation, liquidity, valuation, volatility, prepayment and extension. No part of this material may be reproduced in any form, or referred to in any other publication, without express written permission.