FIRST QUARTER MUNICIPAL BONDS UPDATE
Market Recap
Market volatility continued to be influenced by the tightening in monetary policy by the Federal Reserve. Treasury rates in 2- and 10-year maturities would move to as high as 5.07% and 4.06% respectively, by March 9th on market concerns related to persistent inflation. However, after the bank closures of Signature Bank and Silicon Valley Bank, and concerns that destabilization within the banking sector could lead to tightening in lending activity, Treasuries rallied sharply. Yields in 2- and 10-years fell by -105 and -52 basis points (bps), respectively, over the last three weeks of the quarter1.
For the tax-exempt municipal market, yield levels would track the performance in Treasuries for most of the quarter. Tax-Exempt yields in 10 years fell by -36 bps, and the ratio of 10-year municipal yields to Treasuries ended the quarter modestly lower at 65.4% versus 68% at the start of the quarter. Taxable municipals experienced similar performance, with 10-year yields lower by -30bps during the quarter. Returns for the Bloomberg IG Tax-Exempt Index and the Bloomberg Taxable Muni Index produced results for the quarter of 2.78% and 5.21%, respectively2.
Sector Technicals Generally Favorable for Munis
After a volatile year in Treasury yields during 2022 led to record outflows of ~$150 billion from municipal mutual funds, 2023 has already seen an improvement in flows. For funds that report on a weekly basis, inflows during January and February totaled ~ $4.1 billion, before increased market volatility led to outflows totaling -$2.2 billion during March3. In our opinion, continued stabilization in rates over the balance of the year are expected to maintain the current trend in positive fund flows.
The pattern of municipal new issuance so far this year has also been supportive. Year-to-date issuance of $75.4 billion is down -27% YoY, with both new money issuance (-21%) and refinancing activity (-31.5%) down sharply from last year. Refinancings were expected to be a drag on issuance as the higher interest rate environment substantially reduced the economic benefits of advance refunding/refinancing debt. Consequently, the taxable muni market, which had largely benefited from this type of issuance from 2019 through 2021, has seen very muted activity during 2023, with issuance down -31% YoY4.
Outlook: Taxable Muni Spreads Remain Attractive
Although sector performance for the taxable municipal sector was very strong for the first quarter, mid-March market volatility resulting from the banking crisis weakened relative valuations for taxables. Spreads to Treasuries in 10-year maturities, which had moved tighter by -27bps over the first 2 months of the quarter, gapped out by 38bps over the final month to end the quarter at 106bps. We view this spread, along with spread levels of 51 and 71bps in 3- and 5-year maturities, respectively, as very attractive entry points for the sector. Excluding the three months from March to June of 2020, which represented the worst of the pandemic-induced market dislocations, current indicative spreads for ‘AAA’ munis are now at 10-year wides to historical relationships. Additionally, as of this writing, these spreads out-yield ‘A’-rated low beta industrial corporate bonds by 22, 21 and 22bps, in 3-, 5-, and 10-years, respectively5.
For tax-exempts, in our opinion, we continue to view the tax-adjusted yield profile for this sector at a 21% corporate rate for insurance companies as unattractive, especially in relation to the sizable yield advantage offered by taxable municipals. At the end of the quarter, Treasuries and taxable munis in 10-year maturities provided an excess yield profile over tax-exempts of 75bps and 181bps, respectively, on a tax-adjusted basis. We would view any outperformance by the tax-exempt sector into stronger technicals as a source of funding to build exposure to the taxable municipal sector.
Exhibit 1: Tax-Exempt Relative Valuation Levels
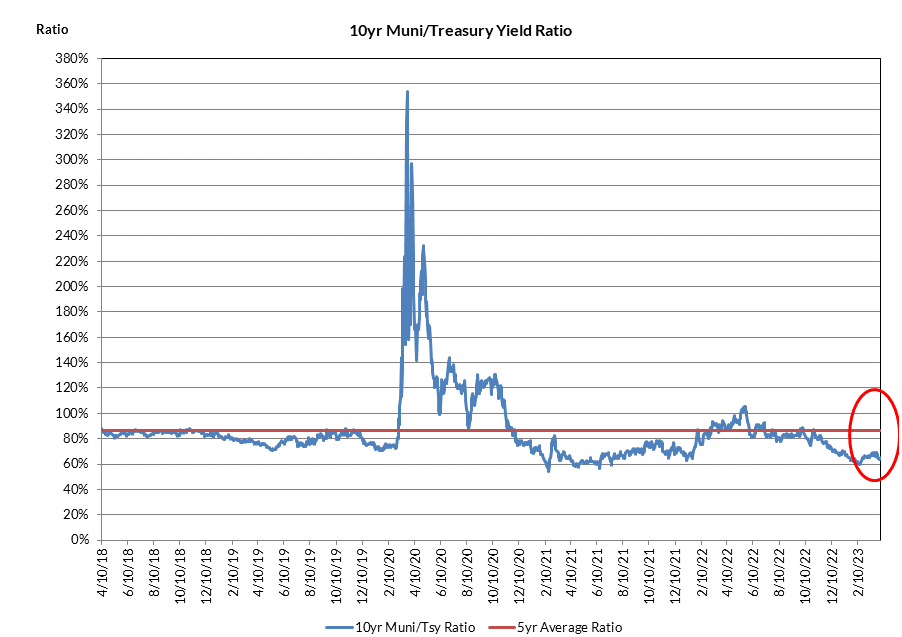
Exhibit 2: Taxable Munis: Compelling Alternative to Tax-Exempts
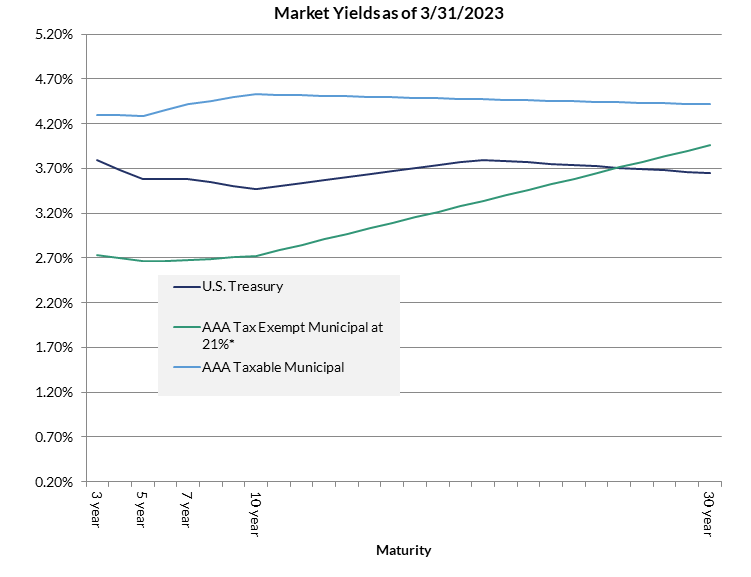
*21% Corp Rate Tax-Adjusted at a Factor of 1.19
1 Bloomberg
2 Bloomberg, Barclays, AAM, Refinitiv
3 Lipper
4 Bond Buyer, Refinitiv
5 AAM, Bloomberg