THIRD QUARTER CORPORATE CREDIT UPDATE
Market Performance – Stronger Economic Data is Supportive for Spreads
In reaction to better-than-expected economic data, the Investment Grade (IG) Corporate bond market generated negative total return in the third quarter due to the increase in Treasury yields, as credit spreads tightened. The option adjusted spread (OAS) fluctuated in a relatively tight range of 112-127 basis points (bps) in the quarter, closing 7 bps tighter at 120 bps. With this spread movement, the IG market generated an excess return versus a duration-neutral Treasury of 1.1% for the third quarter, bringing the YTD excess return to 2.2%1. When including the underlying Treasuries, the IG market returned -3.1% in the third quarter, bringing the total return to 0%2 YTD. This compares to the S&P Index which has returned 13% YTD and the High Yield market 6%3.
Economic data continued to surprise to the upside throughout most of the third quarter, increasing the likelihood that the Federal Reserve (Fed) will not cut rates to the degree the market had anticipated. With the strong upward move in commodity prices, we saw outperformance in IG sectors such as Energy and Metals & Mining. Higher yields attracted buyers for longer maturities, benefitting longer duration sectors like Utilities, Railroads and Life Insurance. In fact, by the end of the quarter, the OAS for 10+ year maturities was less than the OAS for 5-10 year maturities, which rarely happens unless spreads are very wide. Typically, investors want to get paid more for credit risk in the future so the “credit curve” is upward sloping.
Market Outlook – Spreads More Likely to Widen in the Near Term
At an OAS of 120, the IG credit market is reflecting an average level of risk from a historic standpoint. Despite the shape of the yield curve signaling problems ahead, the credit markets and other economic signals such as “Dr. Copper” are reflecting less uncertainty today. Unlike last year when there was uncertainty in regards to the economy and commodity and financial sectors, we have had a solid year of economic growth, commodity prices have normalized and stress in the financial sector appears to have lessened. So, what are those ghosts haunting us in plain sight?
Energy – Energy – Price will be influenced by policy response to events in Israel
How oil prices influence inflation is more uncertain today than it was last week. Prior to this weekend’s attack in Israel, one of the reasons we believed the probability of much higher oil prices was limited was the potential for a “grand bargain” between the U.S., Saudi Arabia and Israel. Part of the negotiations between the three countries centered on Israel making significant concessions to the Palestinians, the U.S. providing Saudi Arabia a security agreement and Saudi Arabia providing increased oil production in the near term. The likelihood of such an agreement is obviously lower today than it was last week.
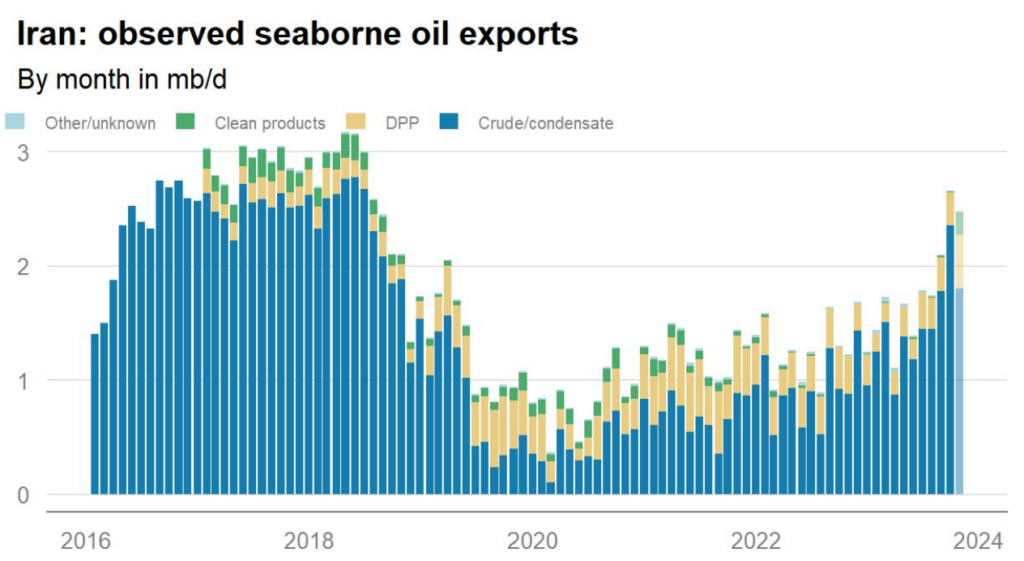
Additionally, since 2022, Washington has largely allowed Iranian exports to bypass American sanctions, thereby keeping oil prices from further aggravating inflationary conditions. Exhibit 1 describes oil exports from Iran over the past several years. We suspect these incremental barrels (about 2.5% of world wide supply), could be at risk depending very much on how Israel, Iran and Saudi Arabia respond to the attacks.
Exhibit 1

We are mindful of the relatively limited effect on crude oil supply following significant geopolitical events in recent years. In May 2019, drone attacks on Saudi oil stations resulted in a temporary suspension of 5 million barrels per day that lasted less than two weeks. More recently, Russian exports declined by 0.5 million barrels per day in March 2022, but fully recovered within three months. Nevertheless, a lack of conviction on policy response by multiple governments makes forecasting oil prices and its effect on inflation challenging.
Commercial Real Estate – Office sector likely to remain challenged becoming a problem for some banks and life insurers
Commercial Real Estate (CRE) valuations are expected to fall 10-20% in 12-24 months, especially within the office and underperforming retail sectors. The confluence of higher rates with fewer avenues of financing leads to lower transaction volumes. This has resulted in only 70% of loans being refinanced at maturity, the lowest since 2005. Even worse, the refinance rate for office loans currently stands at 54%. We expect that the office sector will continue to be challenged due to the expectation for a softer economy and rising unemployment, limiting the ability for physical occupancy to rise above the current levels. In fact, large cities may have to offer incentives for businesses to stay in the cities, and the landlords may have to invest in properties to maintain amenities.
We expect this downward trend to continue with more properties defaulting and/or requesting loan extensions for an additional 24-36 months. We expect extensions for properties with positive cash flows continue to pay down and build equity, but a small percentage of these loans could end up with higher losses at the end of the extension terms if the cashflow or occupancy fail to increase over time. In addition, the non-standard extensions and lenders offering creative financing with shorter terms could bring a large percentage of lease expirations within the loan term, becoming an impediment to future sale or refinancing.
We continue to expect location, good property cashflows, strong and well capitalized borrowers to perform despite the increase in expenses. These borrowers are likely to find financing from insurance companies, larger banks, and private sources of financing looking to take advantage of the drop in CRE prices. A decrease in rates should also help increase the volume of transactions and refinancing of commercial loans.
Life insurers have long been active participants in commercial real estate, with exposures rising to 15% of CRE outstanding as of June 30, 2023, with 13% being mortgage loans4. This year, asset quality concerns stemming from bank failures have increased the level of disclosure for life insurers’ investment portfolios. These disclosures were led by investor inquiry and have been focused on CRE, mainly office exposure. After a brief paralysis in the first quarter of 2023, insurers’ flows into CRE have resumed in the latest reported quarter5, primarily multifamily; however, the office sector has seen its share of CRE in insurers’ portfolios continue to shrink, a similar story to retail properties. We expect insurers to remain cautious with valuations set to decline.
Insurers take different valuation approaches, but the most recent examples of Metlife and Principal Financial Group illustrate the extent of the decline to date. Both insurers now reflect a 25% peak-to-trough valuation decline in office properties. Furthermore, both have included up to 40% valuation drops in their stress scenarios. The severe scenarios would impact capital; however, commercial mortgage loans (CMLs) as a percentage of invested assets at 11% as of year-end 20226 paint a manageable outcome for insurers regarding potential losses. Office exposure makes up 1-6% of invested assets from insurers that have disclosed7.
Our expectations for CRE project a negative adjustment in valuations, and insurers may deploy new capital as those market adjustments occur. Nonetheless, insurers remain well positioned in the market compared to other institutional investors with a bias towards higher quality loans with low loan-to-values (LTVs) invested primarily in Class A properties. For example, as of year-end 2022, 99.8% of loans were in good standing, with 46.7% classified as CML1 and 42.7% as CML28.
The market will remain challenging, with LTVs set to climb as valuations decline and subsequent migration of loans to higher-risk CM designations. However, debt service continues to be supported by cash flows, and we expect the majority of insurers to be able to manage through the real estate cycle with defaults and impairments remaining manageable.
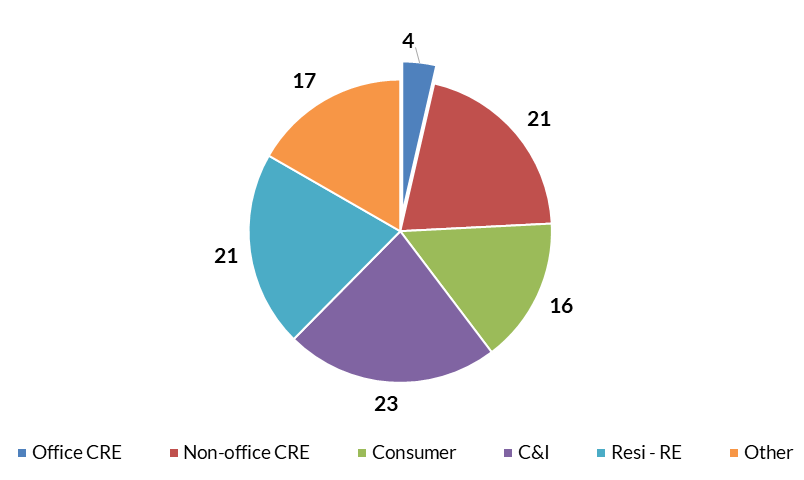
Banks are the largest participants in commercial real estate. However, the majority of the CRE exposure is held on smaller bank balance sheets. In the May Financial Stability Report, the Fed estimated that roughly 70% of the bank CRE loans were held by banks with less $100 billion in total assets. These types of banks include small regional and community banks, suggesting CRE loan performance could vary considerably across the banking industry depending on geography and type of underlying properties. Loans backed by office buildings have drawn the most scrutiny given path of interest rates and pandemic-driven structural shifts in demand, but exposure at the sector level is low at roughly 4% total loans (Exhibit 2)9. In line with general CRE lending, small regional and community banks are purported to have the largest exposures to office-CRE loans, though company level disclosures are not standardized. We estimate that office-CRE loans can be as high as 18% of total loans at some community banks or as little as none at others. While asset quality metrics have not yet been an issue, banks have tightened underwriting standards due in part to expected deterioration in collateral values and the credit quality of loans.
Exhibit 2: Bank Loans by Type (% of total)

Tightening Lending Standards – Further Tightening is Expected to Pressure the Economy
Bank lending standards are expected to tighten further. The July Senior Loan Officer Opinion Survey (SLOOS) showed banks again tightening underwriting standards across all commercial and consumer loan categories. The survey results marked the fifth consecutive quarter of tightening. Lending standards have tightened across all loan categories, but the pace of tightening has been most prominent in commercial and industrial (C&I) portfolios and CRE portfolios. In the July SLOOS, the net percentage of banks tightening C&I loans for large firms reached 50%, while the net percentage of banks tightening CRE loans reached roughly 70%. Both loan categories reached their highest levels since the pandemic. Banks indicated their expectation to raise lending standards across all loan categories through the remainder of 2023, citing economic uncertainty and expected deterioration in collateral values and the credit quality of loans as reasons. In a ‘higher for longer’ interest environment, we believe banks are likely to maintain a tightening bias through early 2024, providing downside risk to bank asset quality and economic activity more broadly.
Consumer – Spending likely to fall next year as liquidity shrinks and savings rates increase
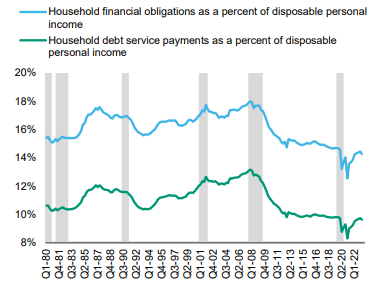
The consumer has been a primary driver of better-than-expected economic growth this year, with the labor market remaining strong, wages and social security payments increasing at a healthy rate and inflation falling. In addition, equity market and home values have increased more than expected, allowing consumers to access liquidity from these sources. While credit card balances have increased, other forms have consumer debt have been fairly stable10 and household balance sheets remain healthy (Exhibit 3). And, while the level is widely disputed, most would agree that consumers continue to have some level of excess savings.
So, what are the risks related to the consumer? Similar to C&I and CRE loans, lenders are tightening standards on all types of consumer loans11. Therefore, liquidity for consumers should start to contract. Moreover, Citigroup estimates that consumers are more likely to start saving in months ahead12. Therefore, one risk is lower than expected consumer spending in 2024. Another risk is higher delinquencies than expected, which will weigh on lenders in addition to CRE and C&I.
Exhibit 3: Household Financial Debt Remains Low
1 Bloomberg Barclays Corporate Index as of 9/30/2023
2 Bloomberg Barclays Corporate Index as of 9/30/2023
3 Bloomberg Barclays High Yield Index as of 9/30/2023
4 Mortgage Bankers Association (MBA)
5 S&P CapitalIQ/SNL
6 S&P CapitalIQ/SNL
7 Company reports
8 NAIC
9 Marcus & Millichap Research Services, Mortgage Bankers Association, Federal Reserve, 2022
10 www.newyorkfed.org/medialibrary/interactives/householdcredit/data/pdf/HHDC_2023Q2
11 Federal Reserve Senior Loan Officer Opinion Survey, July 2023
12 Citigroup “Is the US Saving Rate Set to Surge?” 8/22/2023
Disclaimer: Asset Allocation & Management Company, LLC (AAM) is an investment adviser registered with the Securities and Exchange Commission, specializing in fixed-income asset management services for insurance companies. Registration does not imply a certain level of skill or training. This information was developed using publicly available information, internally developed data and outside sources believed to be reliable. While all reasonable care has been taken to ensure that the facts stated and the opinions given are accurate, complete and reasonable, liability is expressly disclaimed by AAM and any affiliates (collectively known as “AAM”), and their representative officers and employees. This report has been prepared for informational purposes only and does not purport to represent a complete analysis of any security, company or industry discussed. Any opinions and/or recommendations expressed are subject to change without notice and should be considered only as part of a diversified portfolio. Any opinions and statements contained herein of financial market trends based on market conditions constitute our judgment. This material may contain projections or other forward-looking statements regarding future events, targets or expectations, and is only current as of the date indicated. There is no assurance that such events or targets will be achieved, and may be significantly different than that discussed here. The information presented, including any statements concerning financial market trends, is based on current market conditions, which will fluctuate and may be superseded by subsequent market events or for other reasons. Although the assumptions underlying the forward-looking statements that may be contained herein are believed to be reasonable they can be affected by inaccurate assumptions or by known or unknown risks and uncertainties. AAM assumes no duty to provide updates to any analysis contained herein. A complete list of investment recommendations made during the past year is available upon request. Past performance is not an indication of future returns. This information is distributed to recipients including AAM, any of which may have acted on the basis of the information, or may have an ownership interest in securities to which the information relates. It may also be distributed to clients of AAM, as well as to other recipients with whom no such client relationship exists. Providing this information does not, in and of itself, constitute a recommendation by AAM, nor does it imply that the purchase or sale of any security is suitable for the recipient. Investing in the bond market is subject to certain risks including market, interest-rate, issuer, credit, inflation, liquidity, valuation, volatility, prepayment and extension. No part of this material may be reproduced in any form, or referred to in any other publication, without express written permission.
