Market Recap
Market rate performance during the 2nd quarter continued to be influenced by the aggressive pace of tightening in monetary policy by the Federal Reserve. In its efforts to combat persistent inflation, the federal funds rate was pushed higher by 125 basis points (bps) during the quarter, with another 75bps hike expected in July. That resulted in Treasury rates during the quarter in 2 and 10yrs to rise by 62 and 68bps, respectively1.
The higher rate environment continued to provide struggles for the municipal market. Returns for the Bloomberg IG Tax-Exempt Index and the Bloomberg Taxable Muni Index produced negative results for the quarter of -2.94% and -6.20%, respectively2.
Tax-Exempt Relative Valuations Remain Elevated
Relative valuation levels for the tax-exempt market have been under pressure all year from the heavy outflow cycle from mutual funds. For the quarter, outflows totaled -$56.7 billion, and for the year, outflows have produced a new record of -$74.7 billion3. Bid list activity to raise the needed liquidity to cover the outflows averaged $1.5 billion per day, which was an increase of 52% relative to the selling activity that was observed during the first quarter4.
The net result of these weak demand technicals was for relative valuation levels to remain at elevated levels. Muni-to-Treasury yield ratios in 10yrs started the quarter at 93%, would climb to as high as 105% during mid-May, before ending the quarter at 91%5.
Although there remains pressure for the tax-exempt market to absorb additional outflows as the market continues to expect the Federal Reserve to push rates higher, there have been recent signs that this cycle may be slowing. During the first 3 weeks of July, funds that report on a weekly basis have reported average outflows of -$268 million per week. That’s a sharp decline of 90% relative to the reported weekly average of -$2.6 billion during June and a similar decline of 89% relative to the weekly average during the 2nd quarter of $2.4 billion6.
Taxable Munis Continue to Look Attractive
For taxable munis, relative valuation levels have also remained at elevated levels during the quarter. In looking at option adjusted spreads (OAS) for the Bloomberg Taxable Muni Aggregate Index, spreads which started the quarter at 120bps, widened by 16bps to end the month of May at 136bps. However, with taxable munis tracking the stronger performance in corporates during May, the OAS for munis would tighten by 9bps to end the quarter at 127bps. That tightening was evident in performance during June, with the Taxable Muni index producing a positive return of 1.42%7.
Even with the improved performance for the sector during June, we still find that the current spread levels for munis remain attractive. We view the 7 to 30yr range as the most attractive for the sector, with the 10yr area providing the most compelling area relative to historical valuations. In looking back at historical spreads for ‘AAA’ 10yr spreads from 2012 to the end of 2019, we found that the widest spread occurred on 1/3/12 at 95bps. During 2020, after the market disruptions from COVID, we also observed that the average spread in 10yrs from 3/1/20 to 12/31/20 was 97bps. Today, we are observing trading levels for ‘AAA’ taxable munis at ~90bps and that appears to be in line with levels that are more associated with market dislocations over the last 10yrs. Consequently, we view current spread levels in this area of the curve as a very compelling entry point to continue to add to the basis for the sector8.
Outlook: Favorable Technicals and Fundamentals Should Support Spread Performance
Looking forward, we are maintaining our expectation for spread levels to stabilize and eventually tighten over the balance of 2022. We continue to expect supply technicals to provide a favorable backdrop. Refinancing activity tied to advance refundings have largely been absent in 2022 as soaring Treasury rates and taxable muni spread widening have removed the favorable present value savings that were available over the last two years. That’s been reflected in taxable new issuance that has averaged only $4.4 billion per month on a year-to-date basis. That’s down 52% relative to average monthly issuance levels throughout 20219.
Additionally, in our opinion, underlying fundamentals should remain solid for the sector, buoyed by already applied federal stimulus dollars, and strong revenue performance as the economy continues to grow. Revenues for state and local governments through the first quarter of 2022 came in at a very strong 21.3% relative to the 1st quarter of 2021. That follows the strong 22.7% growth in revenues for 4th quarter 2021 versus 4th quarter 2020 levels10. The strength in revenues, combined with COVID -related fiscal stimulus, have left state and local governments in a very stable fiscal position, with state budget stabilization funds at record levels. That should provide these issuers with plenty of budget flexibility in the event that aggressive monetary policy results in a recessionary environment11.
Exhibit 1: Tax-Exempt Relative Valuation Levels
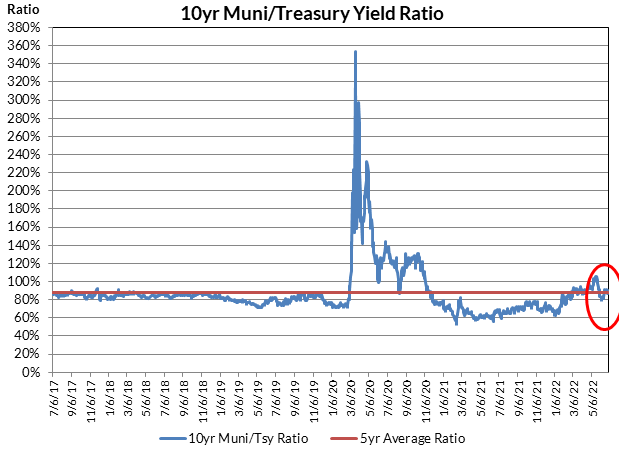
Exhibit 1: Taxable Munis: Compelling Alternative to Tax-Exempts
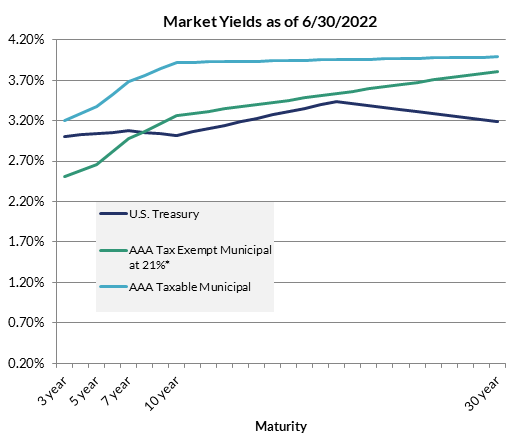
*21% Corp Rate Tax-Adjusted at a Factor of 1.1994
1: Bloomberg
2: Bloomberg, Barclays
3: Lipper
4: Bloomberg
5: Bloomberg, Refinitiv
6: Lipper
7: Bloomberg, Barclays
8: Bloomberg, AAM
9: Bond Buyer
10: US Census Bureau
11: NASBO, Bloomberg, Bond Buyer
Disclaimer: Asset Allocation & Management Company, LLC (AAM) is an investment adviser registered with the Securities and Exchange Commission, specializing in fixed-income asset management services for insurance companies. Registration does not imply a certain level of skill or training. This information was developed using publicly available information, internally developed data and outside sources believed to be reliable. While all reasonable care has been taken to ensure that the facts stated and the opinions given are accurate, complete and reasonable, liability is expressly disclaimed by AAM and any affiliates (collectively known as “AAM”), and their representative officers and employees. This report has been prepared for informational purposes only and does not purport to represent a complete analysis of any security, company or industry discussed. Any opinions and/or recommendations expressed are subject to change without notice and should be considered only as part of a diversified portfolio. Any opinions and statements contained herein of financial market trends based on market conditions constitute our judgment. This material may contain projections or other forward-looking statements regarding future events, targets or expectations, and is only current as of the date indicated. There is no assurance that such events or targets will be achieved, and may be significantly different than that discussed here. The information presented, including any statements concerning financial market trends, is based on current market conditions, which will fluctuate and may be superseded by subsequent market events or for other reasons. Although the assumptions underlying the forward-looking statements that may be contained herein are believed to be reasonable they can be affected by inaccurate assumptions or by known or unknown risks and uncertainties. AAM assumes no duty to provide updates to any analysis contained herein. A complete list of investment recommendations made during the past year is available upon request. Past performance is not an indication of future returns. This information is distributed to recipients including AAM, any of which may have acted on the basis of the information, or may have an ownership interest in securities to which the information relates. It may also be distributed to clients of AAM, as well as to other recipients with whom no such client relationship exists. Providing this information does not, in and of itself, constitute a recommendation by AAM, nor does it imply that the purchase or sale of any security is suitable for the recipient. Investing in the bond market is subject to certain risks including market, interest-rate, issuer, credit, inflation, liquidity, valuation, volatility, prepayment and extension. No part of this material may be reproduced in any form, or referred to in any other publication, without express written permission.