insight
Weaker Performance in Municipals as Higher Rates Pressure Relative Valuations
October 28, 2021
Download PDFTHIRD QUARTER MUNICIPAL BONDS UPDATE
Market Recap
After a solid start to the quarter with Treasury 10yr rates falling by 25 basis points (bps) during July, the balance of the quarter saw rates move higher. Treasury 10yr rates over the last two months of the quarter moved higher by 26bps, as the market grappled with a combination of persistent inflation, along with potential monetary and fiscal policy changes (Source: Bloomberg). The municipal market was weaker in sympathy with the Treasury market, but with a curve steepening bias. Over the same time period, tax-exempt rates in 10yrs moved higher by 32bps, with the slope of the yield curve from 2 to 10yrs steepening by 20bps. Relative valuation metrics moved to weaker levels as well, with 10yr ratios of municipal-to-Treasury yields moving from the quarter’s low point of 59% on July 14th to finish the quarter 17 percentage points higher at 76.6% (Source: Refinitiv, Bloomberg). Taxable municipals spreads during the quarter were also weaker, but most of the widening was observed on the long end of the yield curve. In reviewing data compiled by AAM, ‘AAA’ muni spreads over the quarter moved wider by 2 and 8bps in 10 and 30yrs, respectively. Spreads on the front end of the yield curve were essentially unchanged.
Technicals were Favorable
Although the municipal market saw relative valuations pressured lower over the quarter, supply/demand imbalances were favorable for the sector. Total new issue supply averaged $38 billion per month during the quarter, while an extraordinarily high cycle of reinvestment flows produced an average of $52.6 <Running Header>billion per month of coupons/calls/maturities, outstripping monthly supply by $14B (Source: Bond Buyer, Citigroup).
In addition to the strong reinvestment flows, mutual fund inflows continued to run at a record pace. On a year-to-date basis, overall muni fund inflows totaled ~$89 billion by the end of the quarter. For funds that report on a weekly basis, these inflows averaged a very strong $1.4 billion per week for the quarter (Source: Lipper).
Muted Trading Volume
These favorable demand technicals led to very muted trading volume for the quarter. The lack of available bonds to meet the heavy demand flows led to very limited selling activity during the quarter. Overall secondary trading volume was at a 20yr low, with daily trading volume during the quarter averaging $7.7 billion. That was down ~29% relative to the 3yr average (Source: Bloomberg).
Outlook
As we look forward to the 4th quarter, we could see further pressure on relative valuations to move to even softer levels for the municipal sector. The technical landscape is expected to shift to weaker levels, with supply conditions expected to accelerate during the 4th quarter. Historically, the October/November period produces the second-highest new issuance cycle of the year, while reinvestment flows of coupon/calls/maturities typically moderates during this time period (Source: Bond Buyer). Additionally, mutual fund flows have historically weakened during periods of rising rates. With Treasury rates moving higher during the latter portion of the third quarter, fund flows have already started to moderate. Average weekly flows during September fell to $450 million, a decline of 67% relative to the weekly average for the quarter. During the first three weeks of October, weekly fund flows have fallen by another 50% from September’s levels to an average of $225 million per week (Source: Lipper).
In addition to the weaker technical backdrop, the market could see some additional challenges due to the legislative agenda. The House and Senate are moving closer to reaching an agreement on the Biden administration’s social spending agenda. Per news reporting, the original top line number of $3.5 trillion for the Build Back Better Act is expected to be reduced to ~$2 trillion, while negotiations on potential tax increases and length of time for the funding of the spending measures remain ongoing between the progressive and moderate wings of the democratic caucus.
For the muni market, important measures within the bill could have major implications for supply technicals for the balance of 2021 and for 2022. For the tax-exempt market, the reinstatement of tax-exempt advance refundings could generate an additional $100 to $150 billion a year of tax-exempt new issuance (Source: BofA). As mentioned earlier in this writing, tax-exempt relative valuation metrics like 10yr muni-to-Treasury yield ratios have weakened during the last quarter and at the current 75%, they are now hovering around the highs for the year. However, that level still remains well-through the 10yr average for this metric of 93% (Source: Refinitiv, Bloomberg). In our opinion, a sizable shift higher in supply technicals would lead to a further significant weakening in relative valuations for the sector. Consequently, we are maintaining our negative bias for the sector and advocate a significant underweight to the tax-exempt sector for insurance company accounts.
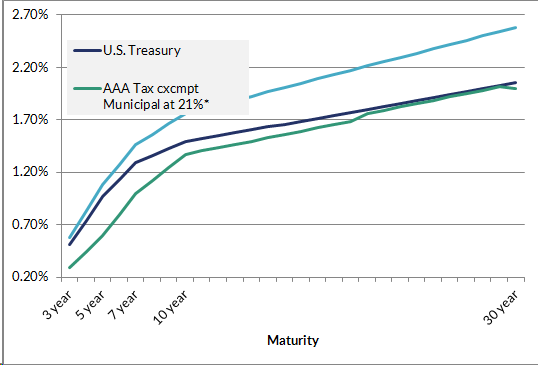
On the taxable side, a return of federally subsidized direct-pay bonds (Build America Bonds) is also currently part of the legislation. This funding mechanism is expected to be tied to the ~$579 billion in new hard infrastructure spending that has already been passed by the Senate and awaits passage in the House of Representatives. However, in our opinion, there’s a major question as to the viability of this program at the initially proposed 35% subsidy level that incorporates the federal government’s coverage of the interest payments on this debt. At current ‘AAA’ taxable muni rate levels, the funding levels available to municipalities in issuing taxable debt net of the 35% subsidy level is almost identical to that of ‘AAA’ tax-exempt yield levels (Source: Refinitiv, Bloomberg). We believe that this subsidy level may need to move to a level in the mid-40% range or higher to entice municipal issuers to utilize this structure. Should this provision remain in the final reconciliation bill upon passage, with an appropriately enticing subsidy level, expectations for supply have been estimated at between 100 to 200B per year (Source: BofA). In our opinion, most of this issuance would be targeted in the 10 to 30yr area of the yield curve, and given the breadth of the investment base in the taxable market, this amount of issuance would be well-received and should not have a material effect on overall spread levels for the taxable muni sector. As observed in Exhibit 2, we continue to view the yield spread advantage of the taxable municipal sector as attractive relative to the tax-exempt sector and we continue to advocate that any exposure to the municipal market be limited to the taxable market.
Exhibit 1: 10yr Muni/Treasury Yield Ratio
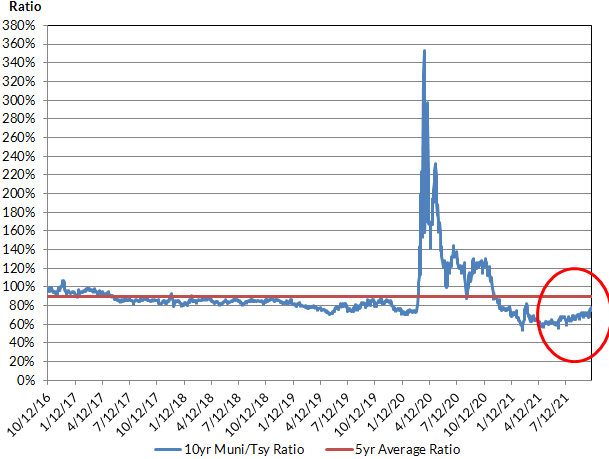
Exhibit 2: Market Yield as of 9/30/2021
Disclaimer: Asset Allocation & Management Company, LLC (AAM) is an investment adviser registered with the Securities and Exchange Commission, specializing in fixed-income asset management services for insurance companies. Registration does not imply a certain level of skill or training. This information was developed using publicly available information, internally developed data and outside sources believed to be reliable. While all reasonable care has been taken to ensure that the facts stated and the opinions given are accurate, complete and reasonable, liability is expressly disclaimed by AAM and any affiliates (collectively known as “AAM”), and their representative officers and employees. This report has been prepared for informational purposes only and does not purport to represent a complete analysis of any security, company or industry discussed. Any opinions and/or recommendations expressed are subject to change without notice and should be considered only as part of a diversified portfolio. Any opinions and statements contained herein of financial market trends based on market conditions constitute our judgment. This material may contain projections or other forward-looking statements regarding future events, targets or expectations, and is only current as of the date indicated. There is no assurance that such events or targets will be achieved, and may be significantly different than that discussed here. The information presented, including any statements concerning financial market trends, is based on current market conditions, which will fluctuate and may be superseded by subsequent market events or for other reasons. Although the assumptions underlying the forward-looking statements that may be contained herein are believed to be reasonable they can be affected by inaccurate assumptions or by known or unknown risks and uncertainties. AAM assumes no duty to provide updates to any analysis contained herein. A complete list of investment recommendations made during the past year is available upon request. Past performance is not an indication of future returns. This information is distributed to recipients including AAM, any of which may have acted on the basis of the information, or may have an ownership interest in securities to which the information relates. It may also be distributed to clients of AAM, as well as to other recipients with whom no such client relationship exists. Providing this information does not, in and of itself, constitute a recommendation by AAM, nor does it imply that the purchase or sale of any security is suitable for the recipient. Investing in the bond market is subject to certain risks including market, interest-rate, issuer, credit, inflation, liquidity, valuation, volatility, prepayment and extension. No part of this material may be reproduced in any form, or referred to in any other publication, without express written permission.